


Phoenix, AZ Car Insurance Guide (Comprehensive)
Free Car Insurance Comparison
Compare Quotes From Top Companies and Save
Eric Stauffer
Licensed Insurance Agent
Eric Stauffer is an insurance agent and banker-turned-consumer advocate. His priority is educating individuals and families about the different types of insurance coverage. He is passionate about helping consumers find the best coverage for their budgets and personal needs. Eric is the CEO of C Street Media, a full-service marketing firm and the co-founder of ProperCents.com, a financial educat...
Licensed Insurance Agent
UPDATED: Feb 1, 2025
It’s all about you. We want to help you make the right coverage choices.
Advertiser Disclosure: We strive to help you make confident car insurance decisions. Comparison shopping should be easy. We are not affiliated with any one car insurance company and cannot guarantee quotes from any single provider.
Our insurance industry partnerships don’t influence our content. Our opinions are our own. To compare quotes from many different companies please enter your ZIP code on this page to use the free quote tool. The more quotes you compare, the more chances to save.
Editorial Guidelines: We are a free online resource for anyone interested in learning more about car insurance. Our goal is to be an objective, third-party resource for everything car insurance related. We update our site regularly, and all content is reviewed by car insurance experts.
| Phoenix Statistics | Details |
|---|---|
| City Population | 1,626,078 |
| City Density | 3,424 people per square mile |
| Average Cost of Car Insurance | $4,765.52 |
| Cheapest Car Insurance Provider | Geico |
| Road Conditions | Poor Share: 23% Mediocre Share: 29% Fair Share: 20% Good Share: 27% Vehicle Operating Costs: $550 |
Phoenix is known for its year-round sunshine, warm temperatures, and eclectic mix of natives and newcomers looking for a place to call home. In fact, the capital of Arizona is not only the most populated city in the state, but also one of the biggest in the country due to its immense population growth over the past decade.
Right in the middle of America’s southwest and situated in the Salt River Valley, Phoenix has been nicknamed the Valley of the Sun. It’s a city where NBA fans cheer on their hometown Suns, a place where you can bask in a comfortable climate, and a great spot for anyone looking to start a new life like a phoenix rising from the ashes.
Whether you’ve lived your entire life in Phoenix or you recently moved here, if you plan to drive, you’ll need to know the city’s driving laws and you’ll need to get a car insurance policy. That’s why we’ve compiled this easy-to-follow guide that covers everything you’ll need to know about buying car insurance and the rules of the road specific to Phoenix.
If you want to know how Phoenix stacks up to the rest of the state, check out our complete Arizona Car Insurance Guide.
After reviewing this guide, you’ll be an expert on these subjects, but if you’re ready to start shopping for car insurance right now, just enter your ZIP code in the box above.
What is the cost of car insurance in Phoenix?
The most important expense outside of monthly car payments that drivers worry about is the cost of auto insurance. They wonder how much coverage they will need, which providers are reliable, and what it will ultimately cost them.
Regardless of whether you plan to pay on a monthly or yearly basis, the cost of car insurance in Phoenix depends on a variety of factors. The most obvious is whether you have a clean driving record. Other things may not be as obvious.
If you only keep the minimum liability coverage requirements (which includes bodily injury liability and property damage liability), you’ll have cheaper rates but less coverage. Liability insurance coverage only covers someone else’s car. To cover your own, you’ll need to get full coverage which includes collision coverage and comprehensive coverage. There are additional options to consider, such as Personal Injury Protection (PIP) and Medical Payments (MedPay) which are both there to cover additional medical bills.
Luckily for you, this section will cover the ins and outs of auto insurance pricing in the Valley of the Sun. By reading through it, you’ll learn how demographics affect the price you pay, the city’s most affordable ZIP codes, most reliable providers, and more.
Free Insurance Comparison
Compare Quotes From Top Companies and Save
Do gender and age affect my car insurance in Phoenix?
It may come as a surprise to some people, but gender, age, and marital status can actually play a significant part in how much you pay for car insurance. Providers look at this information to get a general idea of who you are because it helps them forecast how expensive you might be to insure.
These companies collect data like driving and claims histories from their current user bases, then apply what they’ve learned when adjusting rates for different demographics.
The city of Phoenix has a median age of 33.5, according to DataUSA. That’s a prime age for a resident to be married, which is one factor that contributes to a lower cost of auto insurance. Married couples may have more assets to insure for multi-policy discounts. In your 30’s, you also have a longer driving record, for better or worse. For a quick look at the average rates for Phoenix residents, take a look at the following table.
| Age | Average Annual Rate |
|---|---|
| 17 | $10,105.79 |
| 25 | $3,384.84 |
| 35 | $2,966.21 |
| 60 | $2,747.78 |
Growing older is the name of the game, as you can see that 60-year-olds pay the least on average at $2,747.78 a year. Compare that to a teenager who just received their license and you’re looking at a difference of $7,358.01.
Gender also plays an important role in determining rates. Let’s take a look at the difference in rates between male and female Phoenix residents.
| Demographic | Average Annual Rate |
|---|---|
| Married 60-Year-Old Female | $2,697.88 |
| Married 60-Year-Old Male | $2,797.67 |
| Married 35-Year-Old Female | $2,961.25 |
| Married 35-Year-Old Male | $2,971.16 |
| Single 25-Year-Old Female | $3,235.53 |
| Single 25-Year-Old Male | $3,534.14 |
| Single 17-Year-Old Female | $9,240.33 |
| Single 17-Year-Old Male | $10,971.25 |
As you can see, the preceding table organized the rates from the cheapest at the top to the most expensive on the bottom. This data suggests that males pay more than females at almost every age level. But the price gap is smaller in the middle two age brackets, so the difference is most noticeable for new drivers and those over the age of 60.
What are the cheapest car insurance rates by ZIP Codes in Phoenix?
As the biggest city in the state of Arizona, Phoenix has a number of different neighborhoods, and each one has something unique to offer. You can soak up some culture in the Roosevelt Row Arts District or enjoy a night out on the town in CenPho, the heart of the city.
With so many different areas in the city, you might be wondering what people are paying when it comes to car insurance. As it turns out, Phoenix has nearly 50 ZIP codes, and there are varying ranges in what you pay based on where you live. Take a look to see where the cheapest car insurance rates are in Phoenix.
The following table shows a breakdown of what residents of each Phoenix ZIP code pay each year on average. It’s organized from the cheapest car insurance rates by ZIP codes at the top to the most expensive at the bottom.
| ZIP Code | Average Annual Rate |
|---|---|
| 85086 | $4,053.68 |
| 85087 | $4,090.25 |
| 85085 | $4,129.51 |
| 85048 | $4,138.67 |
| 85044 | $4,181.43 |
| 85045 | $4,204.17 |
| 85083 | $4,285.29 |
| 85050 | $4,345.58 |
| 85027 | $4,406.90 |
| 85054 | $4,407.98 |
| 85097 | $4,460.05 |
| 85028 | $4,477.01 |
| 85024 | $4,489.60 |
| 85039 | $4,500.91 |
| 85022 | $4,550.49 |
| 85032 | $4,556.05 |
| 85018 | $4,615.79 |
| 85065 | $4,676.64 |
| 85053 | $4,686.83 |
| 85016 | $4,710.99 |
| 85026 | $4,738.00 |
| 85023 | $4,749.20 |
| 85037 | $4,750.51 |
| 85008 | $4,785.75 |
| 85073 | $4,788.65 |
| 85014 | $4,811.87 |
| 85020 | $4,825.63 |
| 85042 | $4,847.26 |
| 85029 | $4,957.12 |
| 85025 | $4,961.06 |
| 85003 | $4,961.45 |
| 85007 | $4,983.98 |
| 85004 | $4,987.28 |
| 85012 | $4,990.24 |
| 85043 | $4,999.24 |
| 85013 | $5,013.46 |
| 85034 | $5,035.29 |
| 85006 | $5,049.71 |
| 85041 | $5,069.50 |
| 85021 | $5,073.14 |
| 85040 | $5,084.77 |
| 85051 | $5,106.96 |
| 85015 | $5,153.56 |
| 85033 | $5,179.81 |
| 85035 | $5,185.54 |
| 85031 | $5,297.78 |
| 85019 | $5,327.55 |
| 85017 | $5,394.22 |
| 85009 | $5,433.92 |
Those who live in the community of Anthem in the 85086 ZIP code pay the least for auto insurance with an average annual rate of $4,053.68. This is a full $711.84 more affordable than the city average of $4,765.52.
Those who live in the 85009 ZIP code on the city’s west side pay the most with an average annual rate of $5,433.92. These folks land on the opposite end of the spectrum by paying $668.40 more than the average Phoenician.
What’s the best auto insurance company in Phoenix?
“Best” can mean something different to every driver. With each company, you’ll find some benefits and drawbacks, depending on what kind of driver you are and what’s most important to you. We understand that for most drivers, the most important factor is affordable premiums.
Price varies a lot depending on which company you choose to do business with.
How much you drive, your driving history, desired coverage level, and much more can all leave you with very different quotes from each provider.
Generally speaking, insured drivers mean the best customer service and coverage they need at the most affordable price. Insurance quotes allow drivers to compare their options and find the choice that makes sense. When you enter your zip code in our calculator, we’ll narrow it down to companies in your area with minimal effort from you.
In this section, we’ll break down what the major companies charge based on several factors and help you determine which providers might be right for you.
The most common points to consider when looking for a quality car insurance company are the “three R’s.” You need a provider that is reputable, reliable, and reasonable:
- Reputation is everything in the auto insurance industry. Customers in Phoenix are more inclined to pick a provider that has a track record of success, and this can be determined by looking at what current users are saying about the company.
- Reliability is a fundamental trait that drivers look for in a provider. When the chips are down and you get involved in an accident, you need to count on your insurance company to help you through a difficult situation.
- Paying a reasonable rate for auto insurance is also critically important in a shopper’s decision-making process. No one wants to feel like they’re paying an unfair price to get a decent level of coverage.
In a big city like Phoenix, there are a number of auto insurance providers that drivers consider to be good or even great because they check off the “three R’s.” But what about the companies that are truly the best in the business? The cream of the crop of car insurance in the Valley of the Sun?
This section will provide a breakdown of affordable coverage, commute rates, coverage levels, credit histories, and driving records, and how the best providers consider each category. After you’ve read through the following five topics, you’ll be well on your way to finding the best car insurance company to suit your needs in the city of Phoenix.
Read More: Gilbert, AZ Car Insurance Guide (Comprehensive)
Free Insurance Comparison
Compare Quotes From Top Companies and Save
What are the cheapest car insurance rates by company?
Money talks and that’s why a lot of people are concerned with how much their insurance is going to end up costing them. Take a look at the following table showing what rates companies are charging in the city of Phoenix. These values are based on averages and broken out into different categories based on gender, age, and marital status.
| Group | Married 60-Year-Old Female | Married 60-Year-Old Male | Married 35-Year-Old Female | Married 35-Year-Old Male | Single 25-Year-Old Female | Single 25-Year-Old Male | Single 17-Year-Old Female | Single 17-Year-Old Male | Average |
|---|---|---|---|---|---|---|---|---|---|
| Allstate | $4,306.76 | $4,306.76 | $4,419.60 | $4,419.60 | $4,925.16 | $5,341.70 | $9,466.11 | $12,191.84 | $6,172.19 |
| American Family | $2,998.24 | $2,998.24 | $3,264.65 | $3,264.65 | $3,264.65 | $3,820.35 | $8,649.73 | $11,311.59 | $4,946.51 |
| Farmers | $3,092.54 | $3,300.20 | $3,488.67 | $3,491.25 | $3,945.24 | $4,071.95 | $15,434.42 | $16,048.47 | $6,609.09 |
| Geico | $1,658.73 | $2,135.01 | $1,944.75 | $2,172.44 | $1,765.35 | $1,721.86 | $5,622.93 | $5,896.33 | $2,864.68 |
| Nationwide | $2,723.37 | $2,888.14 | $3,055.09 | $3,109.12 | $3,542.35 | $3,835.44 | $7,705.85 | $9,890.36 | $4,593.72 |
| Progressive | $2,197.51 | $2,087.34 | $2,452.83 | $2,128.39 | $2,621.26 | $2,581.25 | $10,127.71 | $11,275.34 | $4,433.95 |
| State Farm | $3,337.79 | $3,337.79 | $3,770.00 | $3,770.00 | $4,058.40 | $5,133.79 | $11,885.08 | $14,939.62 | $6,279.06 |
| Travelers | $2,233.39 | $2,376.04 | $2,399.40 | $2,526.29 | $2,542.13 | $2,673.68 | $7,161.63 | $9,051.98 | $3,870.57 |
| USAA | $1,732.63 | $1,749.52 | $1,856.29 | $1,858.69 | $2,455.27 | $2,627.25 | $7,109.49 | $8,135.68 | $3,440.60 |
Once you crunch all of the numbers, the cheapest provider in Phoenix is Geico.
This company’s most expensive demographic is the single 17-year-old male group, with an average annual rate of $5,896.33. As you can see from the data, this is every company’s most expensive demographic.
There are exceptions to every rule. While Geico offers the cheapest rates for most demographics, it looks like married 35-year-old males and married 60-year-old males might be able to get a better deal with Progressive.
Also, keep in mind as you review these rates that USAA only insures members of the U.S. military and their families.
What are the best car insurance for commute rates?
Just like in many other cities, residents of Phoenix own cars in large part to have a reliable mode of transportation to and from work. Commute times differ based on where you live and where your workplace is located.
Car insurance companies are very interested in the commuting patterns of the drivers they cover for one simple reason. They want to know the amount of time you spend on the road each day so they can analyze how risky you might be to insure. Here’s a look at what the best car insurance providers in Phoenix charge based on commute.
| Group | 10-Mile Commute. 6,000 Annual Mileage. | 25-Mile Commute. 12,000 Annual Mileage. | Average |
|---|---|---|---|
| Allstate | $6,172.19 | $6,172.19 | $6,172.19 |
| American Family | $4,899.30 | $4,993.72 | $4,946.51 |
| Farmers | $6,609.09 | $6,609.09 | $6,609.09 |
| Geico | $2,815.81 | $2,913.54 | $2,864.68 |
| Nationwide | $4,593.71 | $4,593.71 | $4,593.71 |
| Progressive | $4,433.95 | $4,433.95 | $4,433.95 |
| State Farm | $6,117.42 | $6,440.69 | $6,279.06 |
| Travelers | $3,870.57 | $3,870.57 | $3,870.57 |
| USAA | $3,403.62 | $3,477.59 | $3,440.61 |
After looking at the table, it’s clear that almost every provider charges the same or close to the same regardless of how far your commute might be. Out of this list, only American Family, Geico, State Farm, and USAA have different averages based on distance. Even with these companies, the difference is minor.
What are the best car insurance for coverage level rates?
Drivers are encouraged to pick an insurance plan that works for their needs and budgets. That is why there are different coverage levels ranging from low to high. The following table shows how much these plans cost in Phoenix from the city’s top providers.
| Group | High | Low | Medium | Average |
|---|---|---|---|---|
| Allstate | $6,593.61 | $5,711.69 | $6,211.28 | $6,172.19 |
| American Family | $4,975.42 | $4,760.14 | $5,103.98 | $4,946.51 |
| Farmers | $7,602.03 | $5,542.42 | $6,682.83 | $6,609.09 |
| Geico | $3,322.45 | $2,360.09 | $2,911.48 | $2,864.67 |
| Nationwide | $4,773.24 | $4,360.28 | $4,647.62 | $4,593.71 |
| Progressive | $4,940.49 | $3,837.15 | $4,524.22 | $4,433.95 |
| State Farm | $6,816.24 | $5,615.20 | $6,405.74 | $6,279.06 |
| Travelers | $4,249.42 | $3,425.94 | $3,936.34 | $3,870.57 |
| USAA | $3,670.71 | $3,160.54 | $3,490.56 | $3,440.60 |
Farmers Insurance has the largest change in rates from high coverage to low coverage with a difference of over $2,000. But if you are unsure about whether or not you want full coverage or just liability insurance to meet the minimum legal requirements, take a look at the following video from The Dave Ramsey Show.
Even though the caller is from Illinois, his question still applies to Phoenix residents because it’s a broad topic. Ramsey answers how much coverage you need by going into detail about the difference between liability and comprehensive insurance policies.
Ultimately, it’s up to you to determine what you’re willing to pay and what policy is best for you.
Free Insurance Comparison
Compare Quotes From Top Companies and Save
What are the best car insurance for credit history rates?
Your high school economics teacher most likely talked about the importance of your credit score. If your teacher didn’t educate you about this, then your parents or other family members most likely did.
The reason credit scores are so important is that your credit history will determine how much you will pay on big purchases like cars, homes, and even auto insurance. It could also determine how much the insurance company has to pay to get your annual premiums paid.
If you have a good credit score and a history of timely payments, you end up paying a lot less on car insurance in Phoenix. Take a look at the following table to see what the city’s residents pay based on credit history.
| Group | Good | Fair | Poor | Average |
|---|---|---|---|---|
| Allstate | $5,025.29 | $5,618.05 | $7,873.23 | $6,172.19 |
| American Family | $3,993.23 | $4,632.34 | $6,213.97 | $4,946.51 |
| Farmers | $6,000.67 | $6,309.77 | $7,516.84 | $6,609.09 |
| Geico | $2,067.82 | $2,579.19 | $3,947.01 | $2,864.67 |
| Nationwide | $3,839.02 | $4,397.66 | $5,544.47 | $4,593.72 |
| Progressive | $4,032.59 | $4,318.99 | $4,950.28 | $4,433.95 |
| State Farm | $2,796.19 | $4,471.16 | $11,569.83 | $6,279.06 |
| Travelers | $3,056.90 | $3,839.59 | $4,715.22 | $3,870.57 |
| USAA | $2,635.49 | $3,164.45 | $4,521.87 | $3,440.60 |
It’s difficult to have an immaculate credit history report, but it pays off in the long run. As you can see from the data, most of these companies charge drivers with a poor credit history much more than those with good credit.
The largest change in pricing from a poor credit score to a good score comes from State Farm with a difference of $8,773.64. That’s a very large contrast, so if you’re considering State Farm, check on your credit to see if this is truly a good fit for you.
What are the best car insurance for driving record rates?
It pays to be a good driver — literally. You can save money on your insurance by paying attention while driving, following the rules of the road, and avoiding accidents. This is best done by not succumbing to the temptations of distracted driving, like looking at your phone while you’re behind the wheel.
Auto insurance providers in Phoenix are interested in your driving record since it will give them an idea of how reliable you are behind the wheel. Here’s a look at how insurance premiums vary from company to company based on the driving behaviors of their customer base.
| Group | Clean Record | With One Speeding Violation | With One Accident | With One DUI | Average |
|---|---|---|---|---|---|
| Allstate | $4,944.22 | $6,399.37 | $6,260.76 | $7,084.42 | $6,096.47 |
| American Family | $3,525.12 | $4,091.37 | $5,384.00 | $6,785.55 | $5,231.56 |
| Farmers | $5,583.15 | $6,603.47 | $7,211.81 | $7,037.94 | $6,610.97 |
| Geico | $2,207.41 | $2,207.41 | $3,003.89 | $4,039.99 | $3,083.76 |
| Nationwide | $3,872.83 | $4,343.42 | $4,077.56 | $6,081.05 | $4,677.15 |
| Progressive | $3,903.29 | $4,545.39 | $5,165.24 | $4,121.89 | $4,396.81 |
| State Farm | $5,700.86 | $6,279.06 | $6,857.25 | $6,279.06 | $6,279.06 |
| Travelers | $3,086.93 | $3,852.89 | $4,032.98 | $4,509.47 | $3,876.46 |
| USAA | $2,497.98 | $2,942.41 | $3,589.97 | $4,732.04 | $3,606.66 |
This data indicates that rates will go up the most after a driver gets a DUI added to their record. While speeding and accidents will most likely increase your rate as well, driving under the influence seems to be the most detrimental factor to a driver’s insurance policy.
What are some car insurance factors in Phoenix?
Auto insurance rates are determined by a number of factors, one being the geographical location of the policyholder.
For example, the landscape in Phoenix is a mix of metropolitan, desert, and mountains. The city also sits 1,086 feet above sea level, so insurance providers are not as concerned with things like water damage, but they would pay more attention to that in New Orleans.
This is the type of thinking that will be examined in the next section. We’ll not only cover geographical factors but the city’s growth, income levels, homeownership, education, wage levels, employment, and poverty in Phoenix.
All of these points are considered to be car insurance factors for Phoenicians, so keep reading to learn how these can affect your rate.
Metro Report – Growth and Prosperity
In the introduction of this article, we mentioned how Phoenix has undergone significant growth in the past several years. Whether it’s because of job relocation, the weather, or people looking to retire here, the city currently ranks 12th in growth and 51st in prosperity nationwide.
According to analysis from the Brookings Metro Report, Phoenix shows the following data pertaining to prosperity for the city’s residents:
- +0.5 percent change in productivity (67 out of 100)
- +1.4 percent change in the standard of living (58 out of 100)
- +1.2 percent change in average annual wage (38 out of 100)
The same report also found the following information regarding growth for the major metropolitan area of Phoenix:
- +2.8 percent change in jobs (12 out of 100)
- +3.3 percent change in GMP (23 out of 100)
- +7.9 percent change in jobs at young firms (16 out of 100)
These findings essentially indicate that Phoenix is one of the best cities in the United States when it comes to meaningful growth. However, the prosperity levels of the city have some room for improvement since the productivity and standard of living factors rank on the wrong side of the median ranking of 50.
Median Household Income
The median household income in the Valley of the Sun is $57,957, which is less than the national average of $61,937. It also comes in under the Arizona state average of $59,246.
There are a number of contributing factors that lead to this situation, the most important of which is the current state of the city’s job market. We will examine that in more detail later in this section.
Before we get to that info, take a moment to use our intuitive calculator tool below to see what percentage of your income is spent on auto insurance.
CalculatorPro
Homeownership in Phoenix
Homeowners make up 53.6 percent of the population in Phoenix, giving property owners the slight majority over renters in the city. Why is this important to know? It can affect how much you pay for auto insurance.
In the eyes of a car insurance company, homeowners are considered to be more financially responsible and therefore less risky to insure. Buying property is a major investment, but it could make a significant impact on how much you pay in premiums.
At the very beginning of this article, we learned that the average cost of car insurance in Phoenix is $4,765.52. If more Phoenicians become homeowners instead of continuing on as renters, there’s a great chance that this median figure would be reduced.
More good news: the median property value in Phoenix is $249,100, which is 1.08 times greater than the national average of $229,700. Homeowners in Phoenix take care of their property and if this trend is a sign of things to come, home values will continue to stay above the U.S. average.
Education in Phoenix
Phoenix is known for having a number of reputable schools, and it’s a point of pride for the city. Locals are lucky enough to take advantage of a great selection of high-performing colleges and students travel here from across the country to receive a quality education.
The city itself has a total of 16 elementary and secondary public school districts. In addition to Phoenix’s public education system, there are roughly 80 private schools and an extensive magnet school program that focuses on specialized courses such as aeronautics, agri-business, and computer studies.
When it comes to undergraduate schools, the three biggest institutions in the city are Grand Canyon University, Arizona State University-Downtown Phoenix, and Phoenix College. These three award the most degrees out of Phoenix’s 79 total colleges.
Some of the most popular fields of study for undergraduates in Phoenix are Registered Nursing, General Business Administration and Management, and General Special Education and Training. Of the 38,923 degrees that were awarded, 26,928 went to women while men received 11,995, so it looks like there are considerably more female college students in Phoenix than males.
Wage by Race and Ethnicity in Common Jobs
If you’re wondering about the income levels for Phoenix’s most common jobs, this section is for you.
Based on reports collected from Data USA, we were able to pool detailed information on the wages earned by the city’s different ethnic groups. It may come as a surprise to some, but two different people can work in the same profession but get paid differently.
The following table shows a breakdown of what each ethnic group earns by job type and what percentage of their income goes towards car insurance premiums.
| Ethnicity | Other Managers | Premiums as Percentage of Income | Customer Service Representatives | Premiums as Percentage of Income | Elementary andMiddle School Teachers | Premiums as Percentage of Income | Retail Salespersons | Premiums as Percentage of Income | Cashiers | Premiums as Percentage of Income |
|---|---|---|---|---|---|---|---|---|---|---|
| Asian | $96,140 | 4.96% | $50,043 | 9.52% | $46,655 | 10.21% | $26,218 | 18.18% | $20,450 | 23.30% |
| Other | $92,548 | 5.15% | $25,805 | 18.47% | $31,708 | 15.03% | $27,985 | 17.03% | $15,216 | 31.32% |
| White | $90,718 | 5.25% | $30,575 | 15.59% | $39,874 | 11.95% | $30,094 | 15.84% | $18,414 | 25.88% |
| Two or More Races | $74,063 | 6.43% | $32,641 | 14.60% | $41,814 | 11.40% | $24,254 | 19.65% | $14,612 | 32.61% |
| Black | $62,505 | 7.62% | $29,106 | 16.37% | $35,510 | 13.42% | $32,449 | 14.69% | $14,964 | 31.85% |
| American Indian | $58,145 | 8.20% | $22,912 | 20.80% | $34,674 | 13.74% | $25,883 | 18.41% | $18,354 | 25.96% |
One of the most eye-catching statistics from this data is how high the percentage rates are for lower-paying jobs. Each ethnic group in Phoenix has to set aside a large portion of their take-home pay for car insurance premiums. For example, cashiers and retailers of every race set aside 15 to 30 percent of what they earn in order to have an auto insurance policy.
Wage by Gender in Common Jobs
The difference in pay is not exclusive to race and ethnicity. Gender also plays a role in the earning potential of Phoenix’s most common jobs, and there is a distinct difference between what each gender earns on an annual basis.
The average male has a salary of $62,316 while the median annual pay for a female is $49,405. Therefore, males earn 1.26 percent more than their female counterparts in the Valley of the Sun.
For more detailed information on the differences in wages between genders, take a look at the following table. It provides a breakdown of the earnings the Phoenix workforce takes home and it’s organized by the city’s most popular job categories.
| Gender | Other Managers | Premiums as Percentage of Income | Elementary and Middle School Teachers | Premiums as Percentage of Income | Retail Salespersons | Premiums as Percentage of Income | Cutomer Service Representatives | Premiums as Percentage of Income | Cashiers | Premiums as Percentage of Income |
|---|---|---|---|---|---|---|---|---|---|---|
| Male | $101,934 | 4.68% | $46,602 | 10.23% | $43,301 | 11.01% | $39,662 | 12.02% | $35,545 | 13.41% |
| Female | $72,895 | 6.54% | $41,228 | 11.56% | $37,782 | 12.61% | $34,132 | 13.96% | $24,634 | 19.35% |
Regardless of the job type, males allocate a lower percentage of their annual pay towards car insurance. However, both genders have a similar percentage for school teachers, customer service representatives, and retail workers.
Poverty by Age and Gender
Poverty is an unfortunate reality in cities across the world, and Phoenix is no different; there is a certain percentage of the population that lives at or below the poverty line. In short, that means these residents do not earn enough money to cover the total cost of the essential resources needed to live an adequate lifestyle.
A total of 20.9 percent of Phoenix’s population has confirmed poverty status, which is greater than the national average of 13.1 percent. Females aged 25–34 make up the largest demographic followed by females aged 35–44 and males aged 6–11.
While these figures might seem alarming, it’s important to note that the Census Bureau is mostly responsible for determining these income level thresholds, and it is possible for this to change over time.
Poverty by Race and Ethnicity
As we continue examining the population in Phoenix that lives below the poverty threshold, we should take a look at which ethnic groups made up these figures.
Whites account for 40.6 percent of people who live below the poverty line in Phoenix. They are followed closely by Hispanics at 38.4 percent. Blacks, Asians, Native Americans, and those with two or more ethnicities make up the remaining 21 percent.
Employment by Occupations
As more people continue to move to Phoenix, employment opportunities have grown as well. The Valley of the Sun expanded from a workforce of 729,000 to 837,000 in a single year. This is a breakdown of the top three occupations for these employees:
- Office and Administrative Support Occupations – 109,021 people; 13 percent of the workforce
- Sales and Related Occupations – 88,932 people; 10.6 percent of the workforce
- Management Occupations – 71,551 people; 8.55 percent of the workforce
These three occupations make up a significant part of the workforce in most big cities. Since they cover a wide range of fields, there are a high number of college graduates that flock to these types of jobs.
Free Insurance Comparison
Compare Quotes From Top Companies and Save
What is driving like in Phoenix?
We have already uncovered a lot of information about Phoenix, but the most important thing we’ve yet to touch on is what it’s like to drive there. Seeing as this is an article about car insurance, we should probably get to that sooner rather than later…
Like now. With a GoPro video.
Whether you’re cruising through winding residential neighborhoods or the long stretches of major roadways, Phoenix always makes for a beautiful drive.
Keep reading to learn about major streets and highways, popular destinations, most-seen car models, traffic, weather, road conditions, and alternative forms of transportation in the Valley of the Sun.
What are major roads in Phoenix?
Cars are a popular form of transportation in Phoenix. Thousands of cars travel along the city’s major roadways to see the beauty of the American southwest and experience the charm that is ever-present in the state capital of Arizona.
The following sections will tell you all about Phoenix’s most often traveled highways, popular road trip destinations, road conditions, and helpful information on red-light cameras.
Major Highways in Phoenix
If you ever wondered what an aerial view of Phoenix’s major highway system looks like, check out this visual.
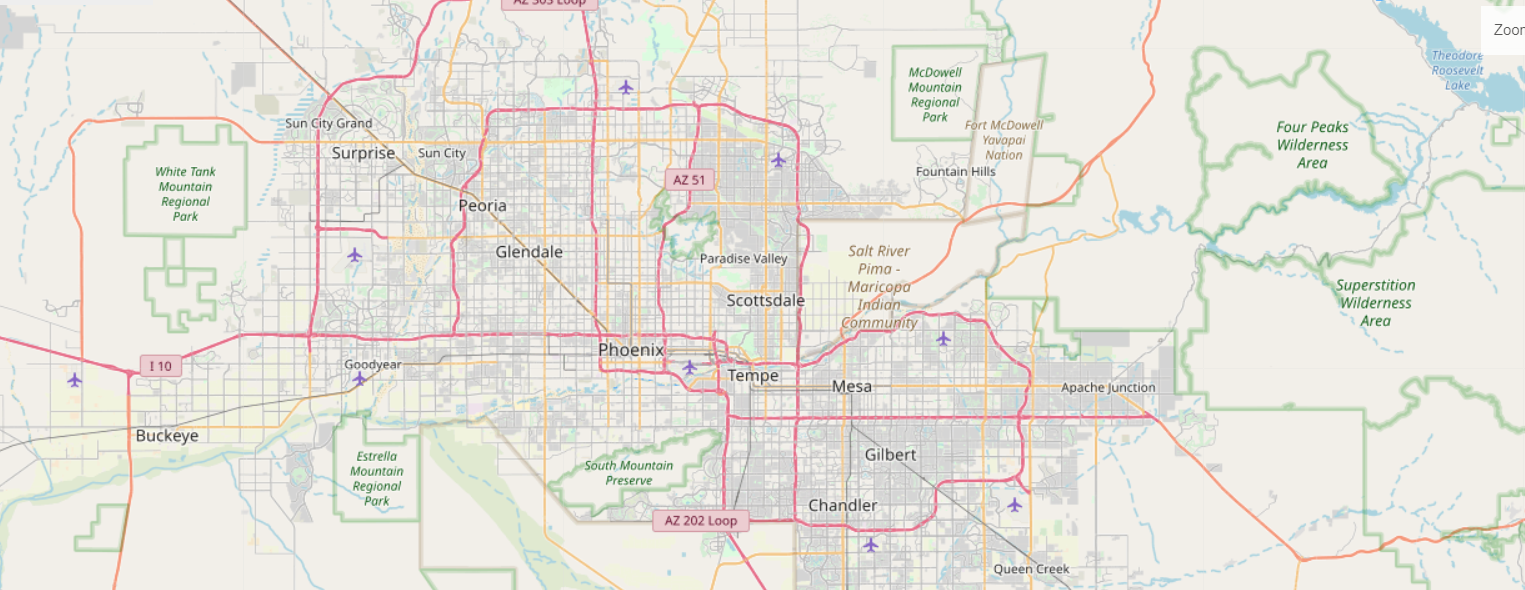
The entire state of Arizona has six active interstate routes that cover a total of 1,168.64 miles. As you can see from the visual above, most of these major highways come through Phoenix, which essentially acts as the hub of this bustling freeway system.
Of these six active Arizona interstate highways, the only three that flow through the city of Phoenix are I-11, I-10, and I-17, with the latter two creating a perfect rectangle surrounding the CenPho (Central Phoenix).
Popular Road Trips/Sites
They don’t call Arizona the Grand Canyon State for no reason. America’s most awe-inspiring national park resides in this state, but the truth is it’s a long way from Phoenix. If you don’t want to take the three and a half hour road trip north to the Grand Canyon, check out this video from Expedia that will give you some insight into Phoenix’s most popular sites.
For a quick recap of the city’s most iconic landmarks, take a look at the following list:
- Orpheum Theater – Located in downtown Phoenix, this iconic theater was originally used for vaudeville acts as part of the nationwide Orpheum Circuit.
- The Rosson House Museum – Built at the end of the 19th century, this historic Victorian home has been converted into a museum for locals and tourists to enjoy.
- Phoenix Art Museum – Foot and car traffic each take a pause when coming upon this contemporary art museum on Central Avenue. This landmark contains artwork from the Renaissance to today and is always bustling with activity.
- Talking Stick Resort Arena and Chase Field – Phoenix is home to several professional sports teams, the majority of which play at these two impressive feats of architecture that are located just blocks apart on Jefferson Street.
- Phoenix Zoo – A great spot for family fun can be found at this zoo, which contains over 1,200 live animals.
While these are all great suggestions, the best way to experience the city is by getting out there on the roads and exploring it for yourself, which brings us to our next section.
Road Conditions in Phoenix
With so much traffic passing through each day, city roads can take a beating. Take a look at the following table to see what the road conditions are like in the Valley of the Sun.
| Vehicle Operating Costs (VOC) | Poor Share | Mediocre Share | Fair Share | Good Share |
|---|---|---|---|---|
| $550 | 23% | 29% | 20% | 27% |
It’s not always smooth sailing on the streets of Phoenix, especially in certain areas like the intersection of Indian School Road and 19th Avenue.
If you do find yourself in a sticky situation on account of poor road conditions, you’ll be glad you have auto insurance.
Does Phoenix use speeding or red-light cameras?
The entire state of Arizona has been using special equipment to track down drivers who speed and run through red-light intersections. Currently, Phoenix has multiple places where speeding cameras and red-light cameras are set up to discourage reckless driving. However, due to a city council vote, that will all be coming to an end soon.
Eliminating these cameras will lead to fewer tickets being issued, which is nice for auto insurance rates. But you can also argue that this might lead to more accidents. Only time will tell.
What type of vehicles are in Phoenix?
Generally speaking, the climate in Phoenix typically goes through two phases a year. December through May is mostly warm and dry, while June through September can be very hot. With so much warm weather, you might be curious as to what types of cars people like to drive in the Valley of the Sun.
This next section will cover the city’s most popular vehicles, the number of cars each household owns, speed traps for certain models, and vehicle theft.
Most Popular Vehicles Owned
Based on newly registered vehicles sold, the most popular vehicles owned in the Phoenix area are the Ford F-Series, Chevrolet Silverado, and Ram pickups, followed by the Toyota Camry and Honda Accord.
Surprisingly, the Nissan 350Z is the most unusually popular vehicle model that is owned in Phoenix, according to a report from YourMechanic.com. This two-seater coupe is known for having a generous amount of horsepower in a small package. However, it was only in production from 2002 to 2009 so those who are still driving these sports models have been taking great care of them.
Overall, you will see a fairly even mix of pickups, cars, and SUVs on the roads of Phoenix, with a few fun surprises like the Nissan 350Z.
How Many Cars per Household
The average number of cars owned per household in Phoenix is two, which is consistent with the national average. These households make up 40.2 percent of the entire Phoenix market.
Following them are one-car households, which make up 23.3 percent of the market, then three-car households at 20.7 percent. Finally, four-car households account for 9.52 percent of the market and five-car households are at 2.95 percent.
Households Without a Car
Only 3.34 percent, or 27,400 households, are without a car in Phoenix.
The number of Phoenix households that are carless has fluctuated over the past few years. Take a look at the following table to see how these figures have changed over a two-year period.
| Year | Households Without Vehicles | Vehicles Per Household |
|---|---|---|
| 2015 | 9.10% | 1.66 |
| 2016 | 8.40% | 1.71 |
The average number of vehicles per household increased from 1.66 to 1.71 from 2015–2016, indicating that car ownership is on the rise.
Speed Traps in Phoenix
Have you ever wondered why some people seem more likely to get speeding tickets than others? The idea that particular models or colors of cars make someone more susceptible to getting pulled over for speeding has long been the subject of debate. But no matter what car you’re driving, if you fly through a speed trap, you’re going to get pulled over.
Urban dwellers don’t have much to worry about on this front, but a few suburbs in the Phoenix metro area made the list of Arizona’s top locales for speed traps. These towns include Chandler, Goodyear, and Paradise Valley.
Free Insurance Comparison
Compare Quotes From Top Companies and Save
How bad is vehicle theft in Phoenix?
Vehicle theft is no joke. And while car thieves often think that they can get away with it under the cover of quiet and darkness, it can sometimes even take a fatal turn. Take a look at this local news video that covers a tragic encounter that occurred after a suspect was caught trying to steal a car.
The FBI reported that Phoenix had a total of 7,815 vehicle thefts in its most recent report. Phoenix ranks as being safer than seven percent of all U.S. cities. For a detailed look at annual crime in the Valley of the Sun, consult the following table.
| Crimes | Total Cases | Per 1,000 Residents |
|---|---|---|
| Violent Crimes | 12,110 | 7.29 |
| Property Crimes | 57,732 | 34.77 |
| Total Crimes | 69,842 | 42.07 |
And if you’re planning to move to the city soon, you might be interested to know that Neighborhood Scout ranked the following as the 10 safest neighborhoods in Phoenix:
- N. Central Avenue/W. Carefree Highway
- S. Desert Foothills Parkway/E. Frye Road
- E. Mountain Sky Avenue/ S. 8th Street
- Near W. Pecos Road
- N. 51st Avenue/N. 55th Avenue
- N. 48th Street/E. Barwick Drive
- N. 56th Street/E. Lone Mountain Road
- N. 64th Avenue/W. Happy Valley Road
- N. Tatum Boulevard/E. Dynamite Boulevard
- N. 27th Avenue/W. Desert Hills Drive
These are loose borders, so it might be helpful to consult Google Maps to get a clear view of these neighborhoods.
How is traffic in Phoenix?
When you put a large group of people together in the same place, things tend to get backed up on the roads. But just how bad is the traffic in the city of Phoenix? Let’s find out.
Traffic Congestion
Data from INRIX shows that Phoenix ranks at number 125 in the world, meaning that there are 124 cities worldwide that experience worse traffic. Here’s how Phoenix traffic is broken down by time and money lost for each driver.
| Phoenix Traffic Congestion | Details |
|---|---|
| Hours Lost in Congestion | 73 |
| Year-Over-Year Change | 3% |
| Cost of Congestion Per Driver | $1,013 |
| Inner City Travel Time (Minutes) | 4 |
| Inner City Last Mile Speed (MPH) | 17 |
When you look at these figures, it’s a little jarring to think that Phoenix residents lose 73 hours and $1,013 sitting in traffic each year. Still, it’s not nearly as bad as other parts of the country, so that’s something to be happy about.
A report from TomTom suggests that it’s best to avoid traveling on Thursdays since that is the day of the week with the heaviest traffic, on average. More info on this can be found in the next table.
| Total Congestion | Extra Travel Time | Morning Peak | Evening Peak | Highways | Non-Highways |
|---|---|---|---|---|---|
| 18% (up 1%) | 23 minutes per day | 35% congestion | 39% congestion | 15% congestion | 19% congestion |
For some more tips on traffic and congestion levels in Phoenix, take a look at the following video.
Transportation
People in Phoenix spend 24 minutes commuting to work, which is right around the national average of 25.7 minutes. Only 1.89 percent of Phoenicians have “super commutes” in excess of 90 minutes.
The majority of commuters, 74.5 percent, drive to work alone. Following this group are those who carpool at 12.6 percent and those who work from home at 6.34 percent.
Busiest Highways
One way to help the flow of traffic is by introducing more lanes for vehicles to travel on. Phoenix has two busy roads that made FHWA’s list of urban highways with the most lanes. I-10 has a total of 13 lanes, while US-60 has 12.
For reference, I-75 in Atlanta sits at the top of the list with 15 lanes.
How safe are Phoenix streets and roads?
While the streets and roads of Phoenix are mostly safe, there has been a steady increase in traffic fatalities over the past few years. Take a look at the table below that shows the total number of fatalities in Maricopa County from 2014 to 2018. These figures were collected from the NHTSA.
| Year | Total Fatalities |
|---|---|
| 2018 | 490 |
| 2017 | 462 |
| 2016 | 478 |
| 2015 | 405 |
| 2014 | 367 |
While this data may seem alarming, it’s important to remember that Phoenix has seen a population increase over these years, so an increase in fatal crashes is all but inevitable.
For details on the types of crashes that occurred in Maricopa County, NHTSA also found the following figures.
| Crash Type | Fatalities 2014 | Fatalities 2015 | Fatalities 2016 | Fatalities 2017 | Fatalities 2018 |
|---|---|---|---|---|---|
| Involving a Single Vehicle Crash | 206 | 200 | 258 | 239 | 289 |
| Involving an Intersection (or Intersection Related) | 141 | 163 | 180 | 172 | 168 |
| Involving Pedestrian Death | 91 | 97 | 131 | 138 | 160 |
| Involving a Roadway Departure | 98 | 122 | 136 | 122 | 156 |
| Involving Passenger Car Occupant Death | 103 | 126 | 121 | 120 | 140 |
| Involving an Alcohol-Impaired Driver (BAC .08+) | 77 | 115 | 131 | 121 | 139 |
| Involving Speeding | 111 | 132 | 148 | 138 | 131 |
| Involving Pedalcyclist Death | 18 | 14 | 22 | 22 | 10 |
As you can see from the data, most crash types have increased their numbers over the years. However, speeding fatalities, intersection-related fatalities, and pedalcyclist fatalities have all gone down in the most recent year. While this is positive news, Phoenix ranks still at number 19 on the list of America’s 20 Deadliest Cities for Cyclists.
Allstate America’s Best Drivers Report
Allstate releases an annual report that shines a light on what it’s like to drive in the country’s 200 largest cities. This is called the Allstate America’s Best Drivers Report and it places a huge emphasis on how safe it is to use the public roads in each city.
According to the 2019 report, Phoenix ranks as the 84th safest city to drive in.
Further details from the report revealed that the average Phoenician has 9.3 years between claims and that there is an average of 27.4 hard-braking events per 1,000 miles.
Ridesharing
Rideshare companies have transformed the way that people get around in Phoenix. Apps like Uber or Lyft make it easy to get from one area of the city to another at an affordable rate. For example, Ride Guru estimates that it will cost you the following amounts to take a trip from the Phoenix Sky Harbor Airport to the Phoenix Convention Center:
- Lyft – $13
- Uber – $13
- TotalRide – $15
- Taxi – $21
Price differences are based on a few variables, like the time and length of the trip, as well as driver demand for each particular rideshare company.
E-star Repair Shops
Even if you’re an exceptional driver, you’ll likely get into an accident at some point. And when that happens, you’ll probably be looking for a good repair shop.
One of the best ways to find one is to simply locate your nearest E-star repair shop. You can do this by typing your address into their convenient E-star repair Shop finder tool.
Take a look at the following list to see a variety of E-star repair shops that are available in the Phoenix area.
| Shop Name | Address | Contact Info |
|---|---|---|
| Gerber - Tempe/University Drive | 2100 W. University Dr. Tempe, AZ 85281 | email: [email protected] P: (480) 774-9999 |
| Chaney's Collision Centers | 7161 N. 61st Ave. Glendale, AZ 85301 | email: [email protected] P: (623) 934-9000 |
| CARSTAR Michael's Collision | 11044 N. Cave Creek Rd. Phoenix, AZ 85020 | email: [email protected] P: (602) 371-1700 |
| Gerber - Tempe/Priest Drive | 8045 S. Priest Dr. Tempe, AZ 85284 | email: [email protected] P: (480) 422-3870 |
| Chapman Auto Body | 999 W. Bell Rd. Phoenix, AZ 85023 | email: [email protected] P: (602) 866-6180 |
| Gerber - Mesa/Broadway Road | 1015 W. Broadway Rd. Mesa, AZ 85210 | email: [email protected] P: (480) 969-5485 |
| Gerber - Scottsdale/San Victor Drive | 8910 E. San Victor Dr. Scottsdale, AZ 85258 | email: [email protected] P: (480) 391-7000 |
| Service King 75th Avenue | 16000 N. 75th Ave. Peoria, AZ 85382 | email: [email protected] P: (623) 486-4810 |
While not all of these repair shops have Phoenix addresses, they still may be geographically close to you. All of these shops are located within 15 miles of Downtown Phoenix’s 85003 ZIP code.
What is the weather like in Phoenix?
They don’t call it the Valley of the Sun for no reason. Phoenix is consistently one of the sunniest cities in the United States. Take a look at the following table that contains information from U.S. Climate Data regarding the weather in Phoenix.
| Phoenix Weather | Statistics |
|---|---|
| Annual High Temperature | 86.7°F |
| Annual Low Temperature | 63.4°F |
| Average Temperature | 75.05°F |
| Average Annual Precipitation – Rainfall | 8.04 inches |
| Days per Year With Precipitation – Rainfall | 36 days |
| Annual Hours of Sunshine | 3,832 hours |
| Average Annual Snowfall | - |
There is typically no snowfall to be found in Phoenix, which is why there is no statistical data available to measure. It truly is a sunny city with minimal precipitation.
However, there is still a possibility of facing natural disasters, such as flash floods during a sudden storm. According to City Data, Maricopa County has experienced 15 natural disasters, which is just over the national average of 13.
Free Insurance Comparison
Compare Quotes From Top Companies and Save
Is public transit available in Phoenix?
Buses are the most common form of public transportation you can find in Phoenix. The majority of these routes operate within the Valley-Metro system, which services all of Phoenix along with Avondale, Chandler, El Mirage, Gilbert, Glendale, Goodyear, Mesa, Peoria, Queen Creek, Scottsdale, Surprise, and Tempe.
In addition to buses, Phoenix also has a light rail system that spans a distance of 28.2 miles in Phoenix, Tempa, and Mesa.
For more information on the most cost- and time-effective ways to use public transit in the Valley of the Sun, take a look at the Valley-Metro online trip planner. This is a great resource if you’re interested in saving money when getting around the city.
Are other alternate transportation options available in Phoenix?
Many cities in America have taken quickly to alternative forms of transportation like bike-share and scooter-share programs.
Phoenix tested out scooter companies Lime and Bird to have their scooters available in the heart of the city but temporarily pulled them due to parking restrictions.
Follow your local news source for more updates on if and when more alternative forms of transportation will become available in Phoenix.
Is parking easy in Phoenix?
There are over 2,000 parking meters located in Downtown Phoenix, Uptown, Capitol, and near the city’s colleges. All of these parking meters are operated by the City of Phoenix Street Transportation Department.
This parking system has made it much easier for residents to find available public parking. Using the city’s smart parking meters is also very simple. Take a look at the following video for instructions.
Free Insurance Comparison
Compare Quotes From Top Companies and Save
How is the air quality in Phoenix?
Nobody wants to breathe in air that isn’t healthy. That’s why the Environmental Protection Agency releases an annual report that measures maximum AQI (Air Quality Index) values and provides further information for different groups of people who might be susceptible to illness on poor air quality days. Here’s what the EPA found for the air quality in Phoenix for a three-year stretch between 2016 and 2018.
| Phoenix-Mesa-Scottsdale | 2016 | 2017 | 2018 |
|---|---|---|---|
| Days With AQI | 366 | 365 | 365 |
| Good Days | 26 | 32 | 42 |
| Moderate Days | 265 | 238 | 238 |
| Days Unhealthy for Sensitive Groups | 67 | 82 | 66 |
| Unhealthy Days | 5 | 11 | 7 |
| Very Unhealthy Days | 3 | 2 | 12 |
As you can see from the table, the air quality in Phoenix is typically moderate but there are days that are deemed unhealthy for sensitive groups. Nonetheless, the good quality days outnumber the poor days, so that’s a good sign, and hopefully the situation will improve in the future.
Are there many military/veterans living in the city?
Phoenix is home to a number of active military personnel and veterans. The majority of vets who live here served in the Vietnam War with a total of 22,422, which is 1.59 times greater than the national average. Following those who served in Vietnam are veterans of the second Gulf War with a total of 14,095 who currently live in the Valley of the Sun.
The closest military base to Phoenix is the Luke Air Force Base, located 22 miles northwest of the city in Glendale.
One benefit of being part of the U.S. military is that you can get great deals on things like premium credit cards and even insurance policies. For example, USAA offers highly competitive car insurance rates for active duty and retired members of the military.
What are some unique city laws?
The Arizona State Legislature has a number of unique laws that apply to the entire state, including Phoenix. Some of the stranger ones include:
- It’s illegal to manufacture imitation drugs. A person can’t manufacture, distribute, or possess with intent to distribute an imitation controlled substance.
- It’s illegal to dig up and move a saguaro cactus. You could face up to 25 years in prison for this offense.
- A person who knowingly or intentionally trips an equine for entertainment or sport is guilty of a class one misdemeanor.
- It’s illegal to feed garbage to a pig.
- The driver of a vehicle who operates on a public street or highway that’s temporarily covered by a rise in water level, and that is barricaded because of flooding, is liable for the expenses of any kind of emergency rescue operation.
Another interesting recent piece of legislation involves food trucks. With mobile eateries gaining popularity among Phoenicians, Maricopa County oversees the distribution of mobile food permits.
In addition to food trucks, tiny homes have also revolutionized the way people are living in Phoenix. Check out this video about an entire community of veterans that have come together to live in these environmentally-conscious living spaces.
Lastly, when it comes to parking in Phoenix, there are three acceptable ways you can safely leave your car without getting cited for parking illegally. According to the city government’s website, any one of the following parking methods is considered legal.
90-Degree Parking
- Most efficient use of space (most parking spaces per square foot of parking)
- Accommodates two-way traffic
- An aisle of 26′ is required
Angle Parking
- Can be used where width of parking area is limited
- Can provide directional control of traffic
- One-way driveways are to be signed “IN and “OUT” at the street entrance, along with pavement marked with arrows in the driveways
- Two-way aisles will not be less than 20′ in width
Parallel Parking
- Should not normally be used behind 90-degree parking
- Must have adequate maneuvering space to enter and exit safely
In this last section, we will provide answers to some of the most frequently asked questions people have about the city of Phoenix. This will hopefully shed light on the things you’re most curious to know about the Valley of the Sun.
Free Insurance Comparison
Compare Quotes From Top Companies and Save
What should I know before moving to Phoenix?
Depending on what part of the country (or world) you’re coming from, the most important thing to know about Phoenix is the climate. Arizona is consistently warm and dry, with little humidity in the air. There are days in the summer when temperatures can reach well over 100°F, and although it doesn’t feel as sweltering as a summer day in Florida, you’re still susceptible to things like sunburn.
How affordable is car Insurance in Phoenix?
As we covered at length earlier in the article, car insurance premiums are determined by a variety of factors such as age, gender, marital status, driving record, and where you live.
With all that being said, Phoenix is mostly on par with the rest of the country on the affordability scale. Furthermore, there are several providers that you can choose from, so remember the info we’ve gone over and you should be able to find the best policy for you.
Is it safe to drive in Phoenix?
Phoenix had a total of 9,876 accidents in 2019, putting it at number 10 on the list of Go Safe Labs’ most dangerous cities for driving in the United States. For some perspective, the top three on the list are Houston with 22,188 accidents, Charlotte with 21,818, and Los Angeles with 19,660. One way you can be proactively safe on the roads of Phoenix is by driving a safe model, and by understanding the history of how much safer vehicles have gotten since the 1980s.
Free Insurance Comparison
Compare Quotes From Top Companies and Save
What are the benefits of moving to Phoenix?
People from all over the country have moved to Phoenix over the past few years to take advantage of its warm weather. There are plenty of other benefits associated with moving to Phoenix, one of which is that there are no tollways. If you moved to Phoenix from the East Coast, you might be surprised at how much money you’ll save by no longer needing to use an E-ZPass or stop to throw change in a tollbooth machine.
What is Phoenix known for?
As the capital of Arizona and one of the most densely populated cities in the area, Phoenix is known as the hub of the American Southwest. You can find art, culture, nightlife, golf courses, fine dining, and more in the bustling urban epicenter located within a desert. Additionally, Phoenix is home to three of Arizona’s professional sports teams: the Coyotes, Diamondbacks, and Suns.
Now that you’ve learned the ins and outs of living and driving in Phoenix, is there anything about auto insurance that you wish to learn more about? If not, get instant quotes by entering your ZIP code below.