Best Car Insurance in Virginia for 2026 [Compare the Top 10 Companies]
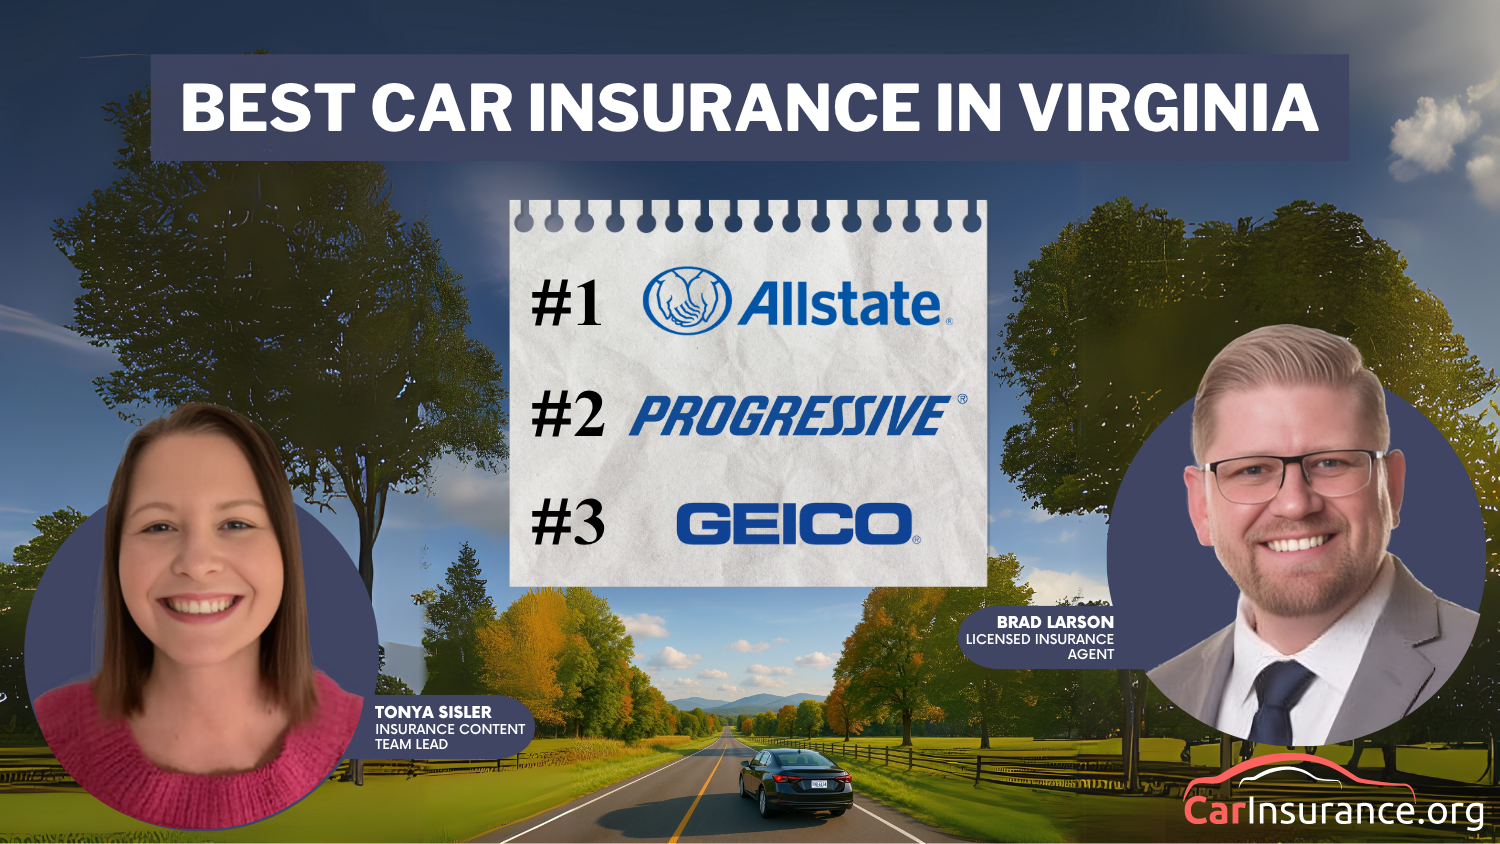
Allstate, Progressive, and Geico offer the best car insurance in Virginia. VA car insurance rates start at just $18 per month. Allstate stands out for its accident forgiveness program. Progressive is great if you’re bundling policies. Geico has consistently low rates and strong customer reviews.
Learn more about Progressive Insurance, what products they offer, what their consumers think about them and ho... more
Learn more about Progressive Insurance, what products they offer, what their consumers think about them and how they compare against other carriers. less
Is State Farm Insurance good? As one of the most popular providers in the country, State Farm boasts strong fi... more
Is State Farm Insurance good? As one of the most popular providers in the country, State Farm boasts strong financial ratings and positive customer reviews. State Farm homeowners insurance reviews rank it in the top ten for claims satisfaction. Coverage is also available in all 50 states, which is important to Florida less
Rachel Bodine graduated from college with a BA in English. She has since worked as a Feature Writer in the insurance industry and gained a deep knowledge of state and countrywide insurance laws and rates. Her research and writing focus on helping readers understand their insurance coverage and how to find savings. Her expert advice on insurance has been featured on sites like PhotoEnforced, All...
Eric Stauffer is an insurance agent and banker-turned-consumer advocate. His priority is educating individuals and families about the different types of insurance coverage. He is passionate about helping consumers find the best coverage for their budgets and personal needs.
Eric is the CEO of C Street Media, a full-service marketing firm and the co-founder of ProperCents.com, a financial educat...
Allstate, Progressive, and Geico offer the best car insurance in Virginia based on pricing, coverage, and customer satisfaction. Allstate is a good option if you prioritize customer service and accident forgiveness.
Our Top 10 Company Picks: Best Car Insurance in Virginia
Progressive is known for its flexible coverage and bundling options, while Geico is known for its affordability and customer satisfaction. These best car insurance companies provide excellent value with a mix of affordability, service, and coverage options.
JUST THE BASICS
Find the best car insurance in Virginia with rates as low as $18 monthly
Comparing Virginia auto insurance quotes can help you save money
Allstate is a top choice for VA drivers seeking accident forgiveness coverage
Ready to find affordable car insurance in Virginia? Use our free comparison tool to instantly compare VA car insurance quotes.
#1 – Allstate: Top Overall Pick
Pros
Wide Coverage Selection: This Allstate car insurance review shows drivers in Virginia can choose from a range of coverage options that fit local needs.
Savings for Safe Drivers: Allstate offers discounts on car insurance in Virginia for those with clean records or who bundle policies.
Strong Local Support: Allstate makes managing car insurance in Virginia easier with responsive and knowledgeable customer service.
Cons
Rates Can Be Higher: Some Virginia drivers may pay more for car insurance with Allstate, especially if they have past violations.
Discount Eligibility Varies: Not all Virginia drivers qualify for Allstate’s discounts, which depend on individual driving history and policy details.
Here’s a breakdown of the Virginia car insurance rates shown in the table—it’s helpful if you’re comparing providers side by side. For drivers looking for the lowest prices, USAA leads with full coverage at just $43 per month and minimum coverage car insurance at $18, though it’s only available to military families.
Virginia Car Insurance Monthly Rates by Provider & Coverage Level
Geico is a solid option for broad accessibility, offering full coverage at $69 and minimum coverage at $29. Progressive and State Farm follow close behind, with full coverage at $61 and $63, respectively. If you prefer a more established brand with strong customer support, Allstate offers full coverage at $103 and minimum coverage at $43.
Allstate stands out for its reliable coverage and top-tier customer service, earning an impressive 90% customer satisfaction rating.
Ty Stewart
Licensed Life Insurance Agent
Meanwhile, Liberty Mutual sits at the higher end with full coverage hitting $129 monthly. So, whether you’re after affordability, brand reputation, or personalized support, this table, along with the best car insurance in Virginia reviews, makes it easier to pinpoint which insurer matches your budget and needs in Virginia.
Virginia Car Insurance by Age and Gender
This table gives you a clear side-by-side view of how car insurance rates in Virginia change based on age and gender. If you’re a younger driver, you’ll notice significantly higher premiums, highlighting one of the benefits of teaching your teen to drive responsibly early on, especially with companies like Liberty Mutual and Allstate charging over $300 per month for 17-year-olds.
Car Insurance Monthly Rates in Virginia by Age & Gender
USAA offers the most affordable coverage across every group, with 25-year-old female drivers paying just $72 monthly. Progressive and Geico also keep prices low, especially for drivers in their mid-20s to early 30s. As drivers get older, rates generally drop, with most providers offering more consistent pricing for those in their 60s.
Whether you’re a teen driver or a retiree, this comparison helps you spot which insurer offers the best value for your specific age and profile. If you’re still unsure, it’s a smart move to compare car insurance quotes Virginia drivers rely on to see which company aligns best with your needs.
Car Insurance Discounts in Virginia
If you’re trying to cut your car insurance bill in Virginia, this discount breakdown from the best auto insurance companies in Virginia is worth a close look. Nationwide leads with a 40% good driver discount, which could make a major difference if you’ve got a clean record. Liberty Mutual offers the biggest anti-theft discount at 35%, a solid benefit if your car has built-in security features.
Car Insurance Discounts From Top Virginia Providers
For drivers who like bundling home and auto, companies like Allstate, American Family, and Geico each offer 25% savings. Meanwhile, USAA and Progressive both stand out with strong good driver and claims-free discounts—ideal if you’re low-risk and follow basic safe driving tips.
Not every company offers across-the-board savings, so it helps to match your situation, whether that’s a new car, a spotless record, or multi-policy discounts.
Virginia’s Most Common Car Insurance Claims & Costs
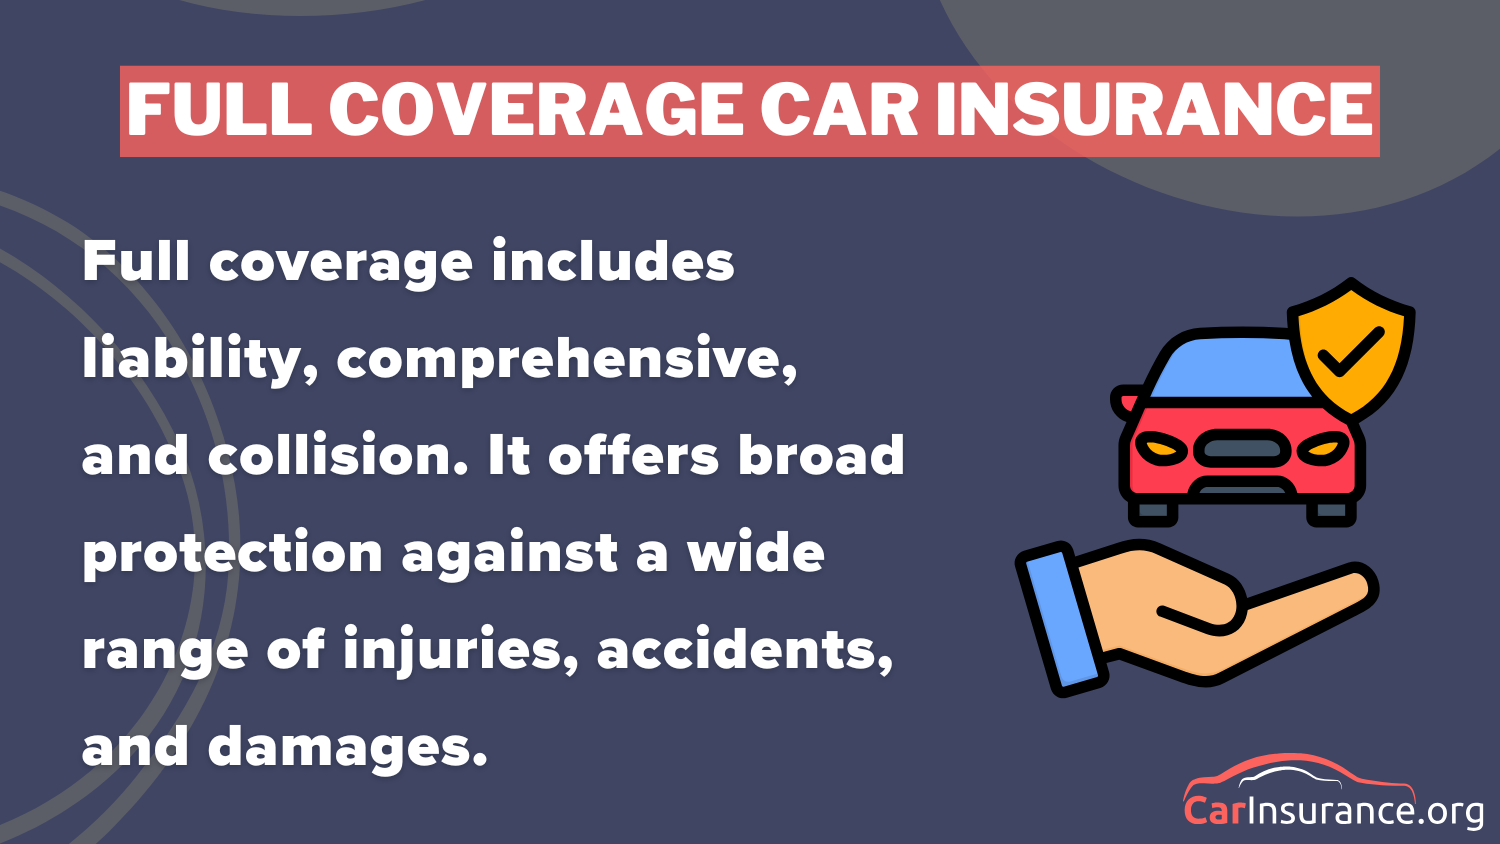
If you’re considering your car insurance options in Virginia, you may want to know the most common types of claims and how much they cost. Claims for collisions make up 40%, at an average of $3,500, so it’s crucial to know the difference between collision vs. comprehensive car insurance when choosing your coverage.
Comprehensive damage, such as hail or hitting a deer, accounts for 25% of claims at $1,800 each. Theft, while less common at 15%, is the most expensive per incident, averaging $4,500. Weather-related claims and vandalism round out the list, each making up 10% of claims, with costs around $3,000 and $2,200, respectively.
Virginia drivers can lower premiums by comparing quotes, increasing deductibles, and choosing coverage that fits their actual driving habits.
Tonya Sisler
Content Team Lead
So when choosing a provider, look for one that balances affordability with strong protection across all these risks—many auto insurance companies in Virginia offer plans that do both.
Virginia Car Insurance Claims & Accidents by City
If you live in a Virginia city with higher accident and claim numbers, you could be paying more for coverage, and this chart gives a clear picture of where that’s happening. For example, Virginia Beach tops the list with 7,000 accidents and 5,500 claims a year, followed closely by Richmond at 6,500 accidents and 5,000 claims.
These areas tend to see higher premiums due to increased risk. In contrast, cities like Lynchburg and Charlottesville report fewer accidents and claims, which often results in lower premiums, and fewer drivers filing a car insurance claim after an accident.
This kind of data matters when you’re comparing quotes; some companies offer better pricing in high-risk zones, while others may specialize in insuring the cheapest cars to insure in Virginia. So knowing how your city stacks up could help you choose a company that won’t overcharge you just for your ZIP code.
Virginia Auto Insurance Premium Trends
Car insurance costs in Virginia are constantly shifting. Prices increase and decrease based on accidents, weather, and even inflation. If you’re wondering whether you’re paying too much or just want a better deal, it helps to know what others are paying.
Virginia Report Card: Auto Insurance Premiums
Category
Grade
Explanation
Weather-Related Risks
A
Few severe weather events, minimal storm impact
Average Claim Size
B+
Moderate claim sizes due to repair costs in metro areas
Vehicle Theft Rate
B
Lower-than-average theft rate, except in some urban areas
Uninsured Drivers Rate
C+
Moderate rate of uninsured drivers, raising some premiums
This report breaks down the latest trends in Virginia auto insurance premiums. Whether you’re comparing quotes or monitoring trends, it gives you insights to help you make better decisions.
If your rates feel too high, you have options. Shopping around, finding discounts, or tweaking your full coverage can help you save. The more you know, the easier it is to get the proper protection at a reasonable price.
When it comes to finding the best car insurance in Virginia, it’s about matching your needs with what each company offers—and understanding how car insurance works can make that choice easier. Allstate is ideal if you want strong support and perks like accident forgiveness.
Progressive offers flexibility and excellent bundling options, and Geico remains a go-to for low prices and strong customer satisfaction. Every driver is different, however, and there is no one-size-fits-all solution when it comes to car insurance. You may need a more powerful policy if many people drive your car or your vehicle has modifications.
Ready to shop around for the best car insurance company in Virginia? Enter your ZIP code to compare VA car insurance rates from top providers near you.
Frequently Asked Questions
What’s the current trend in Virginia auto insurance rates?
Auto insurance rates in Virginia average around $92 per month for full coverage. Rates tend to rise in cities like Richmond and Virginia Beach due to higher traffic and accident risks. Younger drivers and those with poor credit typically see higher premiums.
Is there a car insurance calculator for Virginia to estimate my rates?
Yes, many insurers and quote comparison tools offer a Virginia-specific car insurance calculator. By entering details like your ZIP code, vehicle, and driving history, you can estimate monthly premiums. Calculators often show rate ranges from $40 to over $150 per month.
Explore your VA car insurance options by entering your ZIP code and finding which companies have the lowest rates.
What are the most common Virginia auto insurance discounts drivers can qualify for?
Virginia drivers can often qualify for auto insurance discounts such as safe driving rewards, multi-policy bundling, good student discounts, and usage-based car insurance programs. Some companies offer up to 25% off for combining auto and home coverage or maintaining a clean driving record.
Where can I get cheap full coverage car insurance in Virginia with reliable service?
Geico and Progressive offer some of the cheapest full coverage car insurance options in Virginia, with plans starting at $92 per month. Full coverage includes liability, collision, and comprehensive coverage, which is ideal for newer or financed vehicles.
Where can I find cheap liability car insurance in VA that still meets legal limits?
Liability-only car insurance in Virginia can cost as little as $29 per month through companies like Geico or State Farm. These policies meet the state minimums of 30/60/20 but may not include protection for your own vehicle.
Who offers the best FR-44 insurance in Virginia for drivers with DUI records?
For high-risk drivers needing FR-44 insurance in Virginia, Progressive and Dairyland car insurance are among the top providers. They specialize in filing FR-44 forms and offer plans starting around $120 per month, depending on driving history and vehicle type.
What is the average cost of car insurance in Virginia for full coverage?
The average cost of full coverage car insurance in Virginia is about $100 per month. Rates can vary depending on your age, location, credit score, and vehicle type. Younger drivers and those in cities may pay closer to $150 each month.
Where can I get reliable auto insurance quotes in Virginia fast?
You can get accurate quotes from multiple companies within minutes using online tools like CarInsurance.org’s quote form. Major providers like Progressive, Geico, and Liberty Mutual offer instant auto insurance quotes tailored to Virginia ZIP codes.
What are the best car insurance companies for quotes in Virginia Beach?
For fast and affordable car insurance quotes in Virginia Beach, top choices include Geico, Allstate, and Liberty Mutual. Geico often offers the lowest rates, while drivers asking how they can get Allstate accident forgiveness will find it’s available through their safe driving bonus program. Local rates typically range from $65 to $110 monthly for full coverage.
What’s the best car insurance in Virginia for young drivers under 25?
Geico and State Farm often offer the most competitive rates for Virginia drivers under 25. Geico averages about $135 per month for full coverage, and discounts for good grades or driving courses can lower that further.
How much is a car insurance quote in Richmond, VA, for an average driver?
In Richmond, car insurance quotes for a 35-year-old with a clean record typically start at $90 to $115 per month for full coverage. Factors like driving history and credit score will push the quote higher or lower.
Who provides the most affordable Virginia auto insurance without sacrificing coverage?
Progressive, Geico, and Erie car insurance are known for affordable Virginia auto insurance that balances price and coverage. These providers often offer discounts for electronic payments, safe driving, and bundling policies, helping drivers stay protected without overspending.
What are the best providers for auto insurance in Martinsville, Virginia?
For drivers in Martinsville, Erie Insurance and Nationwide are top picks. Erie offers local agent support and affordable rates starting near $70 per month, while Nationwide offers customizable policies and a range of coverage upgrades.
Find the best comprehensive car insurance quotes by entering your ZIP code into our free comparison tool today.
Who offers the best auto insurance in Virginia Beach for coverage and service?
Allstate, Geico, and USAA (if eligible) are top-rated in Virginia Beach. Allstate stands out for comprehensive coverage and accident forgiveness, while Geico is known for low prices and easy claims. Monthly premiums for full coverage range from $85 to $125.
How can I find Virginia low-cost car insurance with decent protection?
Start by comparing quotes from budget-friendly providers like Geico and Nationwide. If you’re wondering how to lower your car insurance cost, consider raising your deductible or bundling policies. Look for liability coverage that meets Virginia’s legal requirements—rates often range from $38–$55 per month.


 11,640 reviews
 19,116 reviews