
Best Car Insurance in Washington for 2026 [Top 10 Companies in WA]
Farmers, Travelers, and Allstate offer the best car insurance in Washington, with monthly rates starting at $20. Farmers stands out with customizable car insurance options in Washington state, while Travelers holds an A++ rating from A.M. Best. Allstate offers a 25% discount for bundling multiple policies.
Read more


Find the Lowest Car Insurance Rates Today
Quote’s drivers have found rates as low as $42/month in the last few days!


Table of Contents
Table of Contents

Insurance Feature Writer
Rachel Bodine graduated from college with a BA in English. She has since worked as a Feature Writer in the insurance industry and gained a deep knowledge of state and countrywide insurance laws and rates. Her research and writing focus on helping readers understand their insurance coverage and how to find savings. Her expert advice on insurance has been featured on sites like PhotoEnforced, All...
Rachel Bodine

Licensed Insurance Agent
Tim Bain is a licensed insurance agent with 23 years of experience helping people protect their families and businesses with the best insurance coverage to meet their needs. His insurance expertise has been featured in several publications, including Investopedia and eFinancial. He also does digital marking and analysis for KPS/3, a communications and marking firm located in Nevada.
Tim Bain
Updated May 2025
 3,072 reviews
Company Facts
Full Coverage in Washington
A.M. Best Rating
Complaint Level
Pros & Cons
3,072 reviews 1,734 reviews
Company Facts
Full Coverage in Washington
A.M. Best Rating
Complaint Level
Pros & Cons
1,734 reviews 11,640 reviews
Company Facts
Full Coverage in Washington
A.M. Best Rating
Complaint Level
Pros & Cons
11,640 reviewsFarmers, Travelers, and Allstate offer the best car insurance in Washington, with minimum coverage starting at just $20 per month.

Farmers offers Washington car insurance policies that you can tailor. Travelers keeps an A++ rating from A.M. Best for stability. Allstate gives a big 25% discount when you bundle with their local agents.
When you look at the best car insurance in the state of WA, check the prices. But also look at how strong the company is financially.
Our Top 10 Company Picks: Best Car Insurance in Washington
| Company | Rank | Bundling Discount | A.M. Best | Best For | Jump to Pros/Cons |
|---|---|---|---|---|---|

| #1 | 20% | A | Custom Policies | Farmers |
| #2 | 13% | A++ | Coverage Options | Travelers | |
| #3 | 25% | A+ | Local Agents | Allstate | |
| #4 | 25% | A | Loyalty Rewards | American Family | |

| #5 | 10% | A+ | Budgeting Tools | Progressive |
| #6 | 25% | A++ | Lowest Rates | Geico | |
| #7 | 17% | B | Personalized Service | State Farm | |
| #8 | 25% | A | Usage-Based Discounts | Liberty Mutual | |
| #9 | 10% | A++ | Military Benefits | USAA | |
| #10 | 20% | A+ | Safe Driver | Nationwide |
Washington’s minimum liability requirements include $25,000 per person and $50,000 per accident for bodily injury liability coverage, along with $10,000 for property damage.
- Liability coverage matters under Washington’s comparative fault system
- Top WA providers offer specialized mobile apps for easy policy management
- USAA offers the cheapest WA car insurance rates, starting at $20/mo
Find the best comprehensive car insurance quotes in Washington by entering your ZIP code into our free comparison tool today.
#1 – Farmers: Top Overall Pick

Pros
- Customizable Policies: According to our Farmers car insurance review, Washington drivers can enjoy different policy options, allowing them to tailor their coverage.
- Strong Customer Service: Washington policyholders experience less hassle because of Farmers’ local agents providing personalized support and quick claims assistance.
- Comprehensive Coverage Options: Farmers offers the best auto insurance in Washington state with unique perks like accident forgiveness and replacement for new vehicles.
Cons
- Higher Premiums: For Washington drivers seeking affordable coverage, Farmers’ rates are relatively expensive at $44 monthly, especially for full coverage policies in the state.
- Limited Online Tools: Washington policyholders may find Farmers’ mobile app needs significant improvement, as it lacks advanced features.
Free Insurance Comparison
Compare Quotes From Top Companies and Save
#2 – Travelers: Best for Coverage Options

Pros
- Unique Perks: Travelers now offers Washington drivers valuable coverage options, including gap insurance, accident forgiveness, and new car replacement.
- High Rating: Washington customers trust Travelers, which has an A++ rating from A.M. Best, indicating that it is one of Washington’s best car insurance providers.
- Strong Discount Programs: Based on our Travelers car insurance review, Washington drivers can save with bundling, multi-car, safe driver, and hybrid/electric vehicle discounts.
Cons
- Few Local Agents: Washington policyholders may find that Travelers mainly relies on independent agents or digital resources.
- High-Risk Drivers: Washington motorists with accidents or violations may face higher premiums with Travelers compared to other leading insurance providers.
#3 – Allstate: Best for Local Agents

Pros
- Vast Local Agent Network: Knowledgeable local agents provide personalized support and service to Washington drivers seeking reliable coverage.
- Generous Bundling Discounts: Washington policyholders can save 25% more by combining auto insurance with home, renters, or life insurance policies.
- Ergonomic Digital Solutions: Washington motorists can rely on the refreshed Allstate mobile application, which offers improved functionality and the latest updates, to manage their policies.
Cons
- Higher-Than-Average Rates: Washington drivers may find Allstate’s premiums more expensive, with monthly rates averaging $50 across the state.
- Mixed Customer Service Reviews: Our Allstate car insurance review highlighted that some Washington customers report delays in claims processing.
#4 – American Family: Best for Loyalty Awards
Pros
- Loyal Customer Discounts: Washington policyholders with American Family can enjoy significant savings through the loyalty rewards program.
- Strong Customer Support: Washington drivers benefit from American Family’s high customer satisfaction ratings and attentive support through local agents.
- Safe Driving Programs: Check safe driving tips. The KnowYourDrive program rewards Washington’s safe drivers with discounts based on their driving habits.
Cons
- Not All Can Avail: Despite serving Washington, the American Family car insurance review reported that it is only available in 19 states.
- Expensive Premiums: With monthly rates of $40 in Washington, it can be higher than other top providers for drivers without a strong loyalty history in the state.
Free Insurance Comparison
Compare Quotes From Top Companies and Save
#5 – Progressive: Best for Budgeting Tools
Pros
- Unique Pricing Tool: Washington drivers can use Progressive’s Name Your Price Tool to find a policy that fits their state budget constraints.
- Flexible Policies: Progressive introduces new offerings for Washington drivers, such as gap insurance, rideshare coverage, and pet injury protection designed specifically for the state.
- Online and Mobile Experience: Washington customers appreciate Progressive’s simple, easy-to-use website and mobile app for managing policies.
Cons
- Customer Service Complaints: Some Washington policyholders report dissatisfaction with Progressive’s claims processing and response times compared to other providers.
- Limited Support: Washington drivers have limited support due to the state’s limited local agents. Check our Progressive car insurance review to learn more.
#6 – Geico: Best for Lowest Rates
Pros
- Save More: Washington drivers can enjoy substantial discounts from Geico for good driving records, military service, multi-policy bundling, and more state-specific savings.
- Highly Rated Mobile App: Washington policyholders benefit from easy claims filing and bill payments through Geico’s well-designed mobile application.
- Reliable Financial Status: Washington customers can trust Geico’s reliable and prompt claims performance, backed by an A++ rating from A.M. Best for added security in the state.
Cons
- Limited Support: According to our Geico car insurance review, the company prefers Washington customers to use its advanced digital tools rather than in-person service.
- Fewer Customization Options: Washington motorists seeking specialized coverage may find that Geico offers limited options for additional protection compared to other insurers.
#7 – State Farm: Best for Personalized Service

Pros
- Personalized Service: According to our State Farm car insurance review, Washington drivers benefit from one of the largest networks of local agents.
- More Options: Washington policyholders can access new offerings from State Farm, such as rideshare insurance and rental car reimbursement, tailored to state requirements.
- Save with Discounts: Washington drivers can utilize State Farm’s Steer Clear program and accident-free discounts to save money up to 39% on their premiums.
Cons
- Expensive Rates Than Competitors: Washington customers might avoid State Farm’s monthly rates of $30 since they may not align with budget-conscious drivers in the state.
- No Gap Insurance: Unlike other top providers serving Washington, State Farm does not provide gap insurance for individuals financing or leasing vehicles in the state.
Free Insurance Comparison
Compare Quotes From Top Companies and Save
#8 – Liberty Mutual: Best for Usage-Based Discounts

Pros
- Customizable Coverage Options: With flexible policy options, Washington drivers can access accident forgiveness and new car replacement.
- Usage-Based Discounts: Washington motorists can utilize the RightTrack program to earn up to 10% discounts based on their driving behaviors on Washington roads.
- Strong Add-On Features: WA policyholders can include benefits such as enhanced car replacement and roadside assistance suited to the state’s driving conditions.
Cons
- Costly Rates: Washington drivers seeking budget-friendly options may find Liberty Mutual’s monthly premium costs of $41 higher than other providers serving the state.
- Inconsistent Performance: Liberty Mutual car insurance review noted that some Washington customers have experienced problems with claims processing.
#9 – USAA: Best for Military Benefits

Pros
- Military Perks: Our USAA car insurance review shows Washington’s military members and veterans can save money with specialized discounts tailored to their service.
- Highly Rated Services: Washington customers can inquire about their insurance concerns with knowledgeable agents familiar with the state’s specific requirements.
- Cheapest Rate: Military-affiliated Washington residents prefer USAA for its affordable car insurance rates, averaging just $20 monthly across the state.
Cons
- Limited Eligibility: Many Washington drivers cannot access these competitive rates, as only military members, veterans, and their families can qualify for coverage.
- Small Discounts: WA policyholders may find that USAA offers fewer discount opportunities compared to other top providers serving drivers throughout the state.
#10 – Nationwide: Best for Safe Drivers
Pros
- Vanishing Deductible: Washington drivers participating in Nationwide’s defensive driving program can lower their deductible for each year they remain claim-free on state roads.
- SmartRide & SmartMiles: Washington residents with low mileage can benefit from usage-based and pay-per-mile insurance. Read our Nationwide car insurance review for more.
- Extensive Coverage Options: Washington policyholders can access a variety of coverage add-ons, such as accident forgiveness and total loss deductible waivers.
Cons
- Pricey Premiums: Some WA customers find Nationwide’s monthly rate of $31 less affordable than those of other top providers in the state.
- Mixed Reviews: Washington drivers report varied experiences with Nationwide, with some noting slow processes and inconsistent service quality throughout the state.
Free Insurance Comparison
Compare Quotes From Top Companies and Save
Average Cost of Car Insurance in Washington
Getting the most suitable car insurance in Washington involves more than finding the lowest rates. Look beyond the cost to financial strength ratings, customer satisfaction ratings, and claims handling.
Washington Car Insurance Monthly Rates by Provider & Coverage Level
| Insurance Company | Minimum Coverage | Full Coverage |
|---|---|---|
| $50 | $114 | |
| $40 | $91 | |
|
| $44 | $102 |
| $32 | $75 | |
| $41 | $92 | |
| $31 | $70 | |
|
| $26 | $60 |
| $30 | $69 | |
| $35 | $81 | |
| $20 | $46 |
Providers such as Travelers with A++ ratings from A.M. Best are indicative of strong financial strength and dependability for Washington motorists.
Remember that getting the best car insurance rates in Washington state differ based on your driving history, credit score, vehicle type, and location within Washington. Urban areas typically see higher premiums than rural parts of the state.
Washington's comparative fault system makes liability coverage crucial. Even partial responsibility can mean financial exposure, so consider limits beyond the state minimum requirements.
Jeff Root Licensed Insurance Agent
Washington earns a “B” for traffic density and uninsured driver rates, but scores lower for average claim size (B-), weather risks (C+), and vehicle theft (C). These elements directly affect how companies price their policies throughout the state.
Washington Report Card: Car Insurance Premiums
| Category | Grade | Explanation |
|---|---|---|
| Traffic Density | B | High congestion in urban areas |
| Uninsured Drivers Rate | B | Slightly below national uninsured rate |
| Average Claim Size | B- | Above-average repair and medical costs |
| Weather-Related Risks | C+ | Frequent rain, occasional snow risk |
| Vehicle Theft Rate | C | High theft rates in cities |
For drivers seeking affordable car insurance in Washington, we recommend comparing how these rates stack up against other regions in our car insurance rates by state guide.
Car Insurance Discounts From Top Washington Providers
When buying affordable Everett, Washington car insurance, getting discounts can reduce your premium payments by a lot. These discounts can transform standard coverage into cheap full coverage car insurance in Washington for qualified drivers.
Car Insurance Discounts From Top Washington Providers
| Insurance Company | Bundling | Safe Driver | Multi-Vehicle | Defensive Driving | Accident-Free |
|---|---|---|---|---|---|
| 25% | 10% | 25% | 10% | 10% | |
| 29% | 10% | 29% | 10% | 10% | |
|
| 20% | 8% | 20% | 10% | 10% |
| 25% | 16% | 25% | 10% | 22% | |
| 12% | 10% | 12% | 10% | 10% | |
| 20% | 7% | 20% | 10% | 10% | |
|
| 12% | 4% | 12% | 10% | 10% |
| 20% | 5% | 20% | 10% | 39% | |
| 13% | 6% | 13% | 10% | 10% | |
| 10% | 5% | 10% | 10% | 10% |
The most common discounts include bundling (combining auto with home or renters insurance), safe driver rewards, multi-vehicle policies, defensive driving course completion, and accident-free records.
While companies like Geico offer substantial safe driver discounts (16%), others like Progressive have more modest offerings. For Washington residents seeking maximum savings, consider which discounts align with your specific situation when comparing Washington car insurance quotes from different providers.
Largest Companies’ Financial Rating in Washington
The first, and maybe most important, aspect to consider when finalizing which companies to look at is financial strength. You want to be sure your insurer isn’t going under any time soon, leaving you with inadequate coverage and probably a lot of lost money.
Since not everyone has a business degree to analyze the balance sheet of insurance providers, we’ve consulted the financial ratings from A.M. Best Credit Rating. A.M. Best is one of the most reputable credit rating agencies in the insurance industry.
A.M. Best assigns ratings in the scale of A++ to D, which rate insurance providers from superior to poor ability to meet insurance obligations in the long term.
The best car insurance companies in Washington are doing incredibly well across the board. The lowest grade (PEMCO Mutual Insurance Co with a B++) is still well above average.
So, wherever you get your insurance from, you shouldn’t have to worry about your company going under.
Free Insurance Comparison
Compare Quotes From Top Companies and Save
Washington Car Insurance Requirements and Claims
When looking for cheap car insurance in Washington, you need to know the minimum requirements. Washington law requires all drivers to carry liability insurance with a minimum of:
- $25,000 for bodily injury or death per person
- $50,000 for total bodily injury or death per accident
- $10,000 for property damage per accident
Washington is a “comparative fault” state, so if you cause an accident, you’re financially responsible for all damages unless a court says otherwise. These minimums only cover damages to others—not you, your passengers or your vehicle.
5 Most Common Car Insurance Claims in Washington
| Claim Type | Portion of Claims | Cost per Claim |
|---|---|---|
| Windshield Damage | 30% | $1,500 |
| Rear-end Collisions | 29% | $10,000 |
| Single Vehicle Accidents | 19% | $$15,000 |
| Intersection Accidents | 12% | $20,000 |
| Parked Car Damage | 7% | $5,000 |
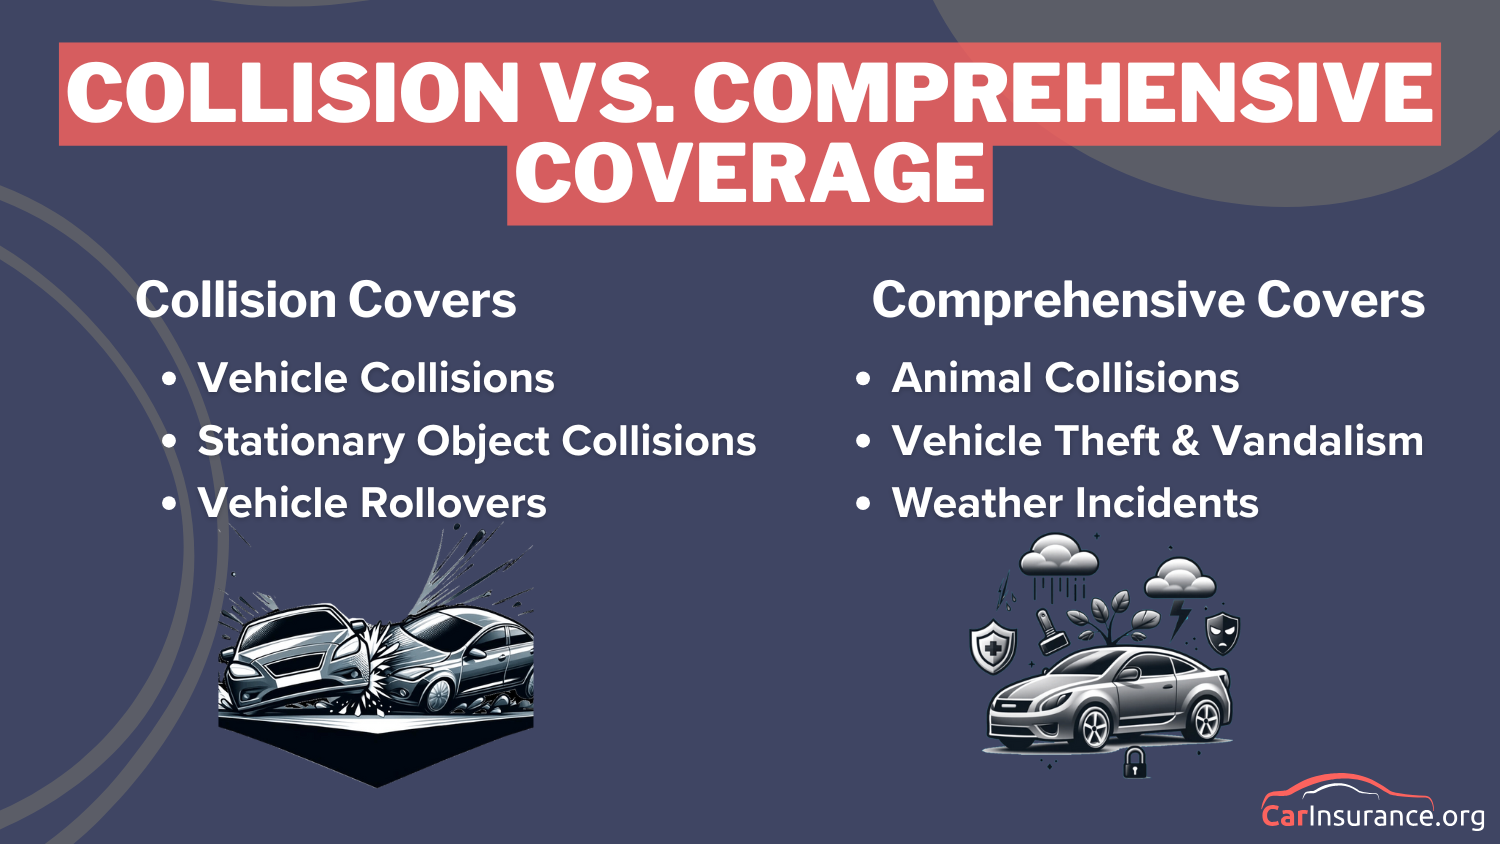
Know the different types of car insurance coverage you want to add to your policy. While it has comprehensive coverage, it costs more, but it’s much better than minimum coverage alone.
Knowing the most common claims can help you choose the right coverage beyond the minimums when comparing Washington auto insurance quotes.
Cheapest Rates by ZIP Code in Washington
Location matters when it comes to how much car insurance is in Washington state. Our data shows Seattle has 10,000 accidents and 8,000 claims per year, followed by Spokane (8,500 accidents/7,000 claims) and Tacoma (7,500 accidents/6,500 claims).
Washington Accidents & Claims per Year by City
| City | Accidents per Year | Claims per Year |
|---|---|---|
| Bellevue | 5,000 | 4,000 |
| Bellingham | 3,500 | 2,500 |
| Everett | 4,500 | 3,500 |
| Kent | 4,400 | 3,400 |
| Renton | 4,000 | 2,900 |
| Seattle | 10,000 | 8,000 |
| Spokane | 8,500 | 7,000 |
| Tacoma | 7,500 | 6,500 |
| Vancouver | 6,000 | 5,000 |
| Yakima | 4,350 | 3,000 |
Even smaller cities like Bellingham have 3,500 accidents and 2,500 claims per year. That’s why WA’s car insurance is more expensive in urban areas than rural areas.
Read More: America’s Safest Driving Cities
Where you live also influences rates. In general, drivers living in an urban area are more likely to be in an accident and thus, face higher premiums.
Washington Car Insurance Monthly Rates by ZIP Code
| ZIP | Rates |
|---|---|
| 98001 | 313 |
| 98002 | 312 |
| 98003 | 311 |
| 98004 | 282 |
| 98005 | 275 |
| 98006 | 285 |
| 98007 | 283 |
| 98008 | 283 |
| 98010 | 286 |
| 98011 | 283 |
| 98012 | 287 |
| 98013 | 282 |
| 98014 | 286 |
| 98019 | 280 |
| 98020 | 296 |
| 98021 | 283 |
| 98022 | 279 |
| 98023 | 314 |
| 98024 | 288 |
| 98026 | 295 |
| 98027 | 287 |
| 98028 | 292 |
| 98029 | 281 |
| 98030 | 312 |
| 98031 | 314 |
| 98032 | 309 |
| 98033 | 275 |
| 98034 | 285 |
| 98036 | 296 |
| 98037 | 298 |
| 98038 | 291 |
| 98039 | 289 |
| 98040 | 296 |
| 98042 | 308 |
| 98043 | 296 |
| 98045 | 278 |
| 98047 | 304 |
| 98050 | 285 |
| 98051 | 288 |
| 98052 | 277 |
| 98053 | 289 |
| 98055 | 315 |
| 98056 | 309 |
| 98057 | 316 |
| 98058 | 306 |
| 98059 | 299 |
| 98061 | 246 |
| 98062 | 308 |
| 98065 | 278 |
| 98068 | 248 |
| 98070 | 266 |
| 98072 | 283 |
| 98074 | 284 |
| 98075 | 284 |
| 98077 | 288 |
| 98087 | 290 |
| 98092 | 306 |
| 98101 | 299 |
| 98102 | 303 |
| 98103 | 298 |
| 98104 | 309 |
| 98105 | 303 |
| 98106 | 329 |
| 98107 | 298 |
| 98108 | 336 |
| 98109 | 306 |
| 98110 | 233 |
| 98112 | 303 |
| 98115 | 309 |
| 98116 | 313 |
| 98117 | 297 |
| 98118 | 340 |
| 98119 | 300 |
| 98121 | 302 |
| 98122 | 311 |
| 98125 | 314 |
| 98126 | 329 |
| 98131 | 311 |
| 98132 | 311 |
| 98133 | 312 |
| 98134 | 319 |
| 98136 | 318 |
| 98144 | 329 |
| 98146 | 318 |
| 98148 | 311 |
| 98154 | 297 |
| 98155 | 301 |
| 98158 | 325 |
| 98161 | 309 |
| 98164 | 310 |
| 98166 | 314 |
| 98168 | 330 |
| 98174 | 312 |
| 98177 | 307 |
| 98178 | 327 |
| 98188 | 322 |
| 98198 | 308 |
| 98199 | 299 |
| 98201 | 289 |
| 98203 | 285 |
| 98204 | 290 |
| 98205 | 281 |
| 98208 | 282 |
| 98220 | 230 |
| 98221 | 211 |
| 98222 | 217 |
| 98223 | 257 |
| 98224 | 280 |
| 98225 | 213 |
| 98226 | 214 |
| 98229 | 215 |
| 98230 | 220 |
| 98232 | 224 |
| 98233 | 221 |
| 98235 | 225 |
| 98236 | 233 |
| 98237 | 230 |
| 98239 | 212 |
| 98240 | 223 |
| 98241 | 245 |
| 98243 | 219 |
| 98244 | 224 |
| 98245 | 211 |
| 98247 | 223 |
| 98248 | 222 |
| 98249 | 219 |
| 98250 | 212 |
| 98251 | 265 |
| 98252 | 262 |
| 98253 | 216 |
| 98255 | 225 |
| 98256 | 252 |
| 98257 | 218 |
| 98258 | 268 |
| 98259 | 264 |
| 98260 | 224 |
| 98261 | 211 |
| 98262 | 219 |
| 98263 | 227 |
| 98264 | 222 |
| 98266 | 228 |
| 98267 | 230 |
| 98270 | 272 |
| 98271 | 272 |
| 98272 | 273 |
| 98273 | 220 |
| 98274 | 221 |
| 98275 | 281 |
| 98276 | 226 |
| 98277 | 210 |
| 98278 | 209 |
| 98279 | 218 |
| 98281 | 228 |
| 98282 | 221 |
| 98283 | 232 |
| 98284 | 224 |
| 98286 | 231 |
| 98287 | 254 |
| 98288 | 270 |
| 98290 | 273 |
| 98292 | 240 |
| 98294 | 262 |
| 98295 | 226 |
| 98296 | 279 |
| 98297 | 234 |
| 98303 | 276 |
| 98304 | 260 |
| 98305 | 213 |
| 98310 | 229 |
| 98311 | 225 |
| 98312 | 226 |
| 98314 | 231 |
| 98315 | 226 |
| 98320 | 219 |
| 98321 | 274 |
| 98323 | 280 |
| 98325 | 212 |
| 98326 | 211 |
| 98327 | 281 |
| 98328 | 275 |
| 98329 | 265 |
| 98330 | 258 |
| 98331 | 212 |
| 98332 | 264 |
| 98333 | 267 |
| 98335 | 265 |
| 98336 | 243 |
| 98337 | 234 |
| 98338 | 294 |
| 98339 | 212 |
| 98340 | 232 |
| 98342 | 236 |
| 98343 | 216 |
| 98344 | 281 |
| 98345 | 230 |
| 98346 | 236 |
| 98348 | 273 |
| 98349 | 272 |
| 98350 | 219 |
| 98351 | 273 |
| 98354 | 305 |
| 98355 | 255 |
| 98356 | 239 |
| 98357 | 223 |
| 98358 | 215 |
| 98359 | 243 |
| 98360 | 284 |
| 98361 | 243 |
| 98362 | 210 |
| 98363 | 211 |
| 98364 | 230 |
| 98365 | 215 |
| 98366 | 231 |
| 98367 | 235 |
| 98368 | 205 |
| 98370 | 226 |
| 98371 | 298 |
| 98372 | 298 |
| 98373 | 295 |
| 98374 | 293 |
| 98375 | 302 |
| 98376 | 216 |
| 98377 | 241 |
| 98378 | 249 |
| 98380 | 231 |
| 98381 | 216 |
| 98382 | 207 |
| 98383 | 224 |
| 98384 | 232 |
| 98385 | 278 |
| 98387 | 309 |
| 98388 | 300 |
| 98390 | 300 |
| 98391 | 287 |
| 98392 | 231 |
| 98394 | 261 |
| 98396 | 272 |
| 98397 | 271 |
| 98398 | 271 |
| 98402 | 310 |
| 98403 | 301 |
| 98404 | 326 |
| 98405 | 310 |
| 98406 | 302 |
| 98407 | 302 |
| 98408 | 321 |
| 98409 | 316 |
| 98413 | 307 |
| 98416 | 299 |
| 98418 | 314 |
| 98421 | 314 |
| 98422 | 315 |
| 98424 | 303 |
| 98433 | 299 |
| 98439 | 297 |
| 98443 | 304 |
| 98444 | 323 |
| 98445 | 306 |
| 98446 | 307 |
| 98447 | 321 |
| 98465 | 307 |
| 98466 | 300 |
| 98467 | 301 |
| 98498 | 298 |
| 98499 | 306 |
| 98501 | 243 |
| 98502 | 239 |
| 98503 | 252 |
| 98505 | 244 |
| 98506 | 241 |
| 98512 | 238 |
| 98513 | 245 |
| 98516 | 245 |
| 98520 | 219 |
| 98522 | 236 |
| 98524 | 252 |
| 98526 | 223 |
| 98527 | 234 |
| 98528 | 243 |
| 98530 | 248 |
| 98531 | 237 |
| 98532 | 225 |
| 98533 | 242 |
| 98535 | 224 |
| 98536 | 225 |
| 98537 | 227 |
| 98538 | 243 |
| 98539 | 243 |
| 98540 | 252 |
| 98541 | 226 |
| 98542 | 250 |
| 98544 | 248 |
| 98546 | 242 |
| 98547 | 228 |
| 98548 | 241 |
| 98550 | 221 |
| 98552 | 223 |
| 98554 | 238 |
| 98555 | 238 |
| 98556 | 243 |
| 98557 | 228 |
| 98558 | 286 |
| 98559 | 236 |
| 98560 | 237 |
| 98561 | 238 |
| 98562 | 229 |
| 98563 | 223 |
| 98564 | 232 |
| 98568 | 231 |
| 98569 | 219 |
| 98570 | 236 |
| 98571 | 226 |
| 98572 | 241 |
| 98575 | 226 |
| 98576 | 256 |
| 98577 | 236 |
| 98579 | 243 |
| 98580 | 286 |
| 98581 | 248 |
| 98582 | 246 |
| 98583 | 229 |
| 98584 | 237 |
| 98585 | 226 |
| 98586 | 239 |
| 98587 | 223 |
| 98588 | 243 |
| 98589 | 248 |
| 98590 | 238 |
| 98591 | 235 |
| 98592 | 244 |
| 98593 | 236 |
| 98595 | 221 |
| 98596 | 239 |
| 98597 | 259 |
| 98601 | 258 |
| 98602 | 234 |
| 98603 | 249 |
| 98604 | 269 |
| 98605 | 232 |
| 98606 | 269 |
| 98607 | 253 |
| 98609 | 234 |
| 98610 | 248 |
| 98611 | 235 |
| 98612 | 239 |
| 98613 | 227 |
| 98614 | 251 |
| 98616 | 253 |
| 98617 | 227 |
| 98619 | 226 |
| 98620 | 223 |
| 98621 | 241 |
| 98622 | 264 |
| 98623 | 227 |
| 98624 | 242 |
| 98625 | 237 |
| 98626 | 231 |
| 98628 | 231 |
| 98629 | 259 |
| 98631 | 243 |
| 98632 | 231 |
| 98635 | 229 |
| 98637 | 240 |
| 98638 | 245 |
| 98639 | 244 |
| 98640 | 238 |
| 98641 | 241 |
| 98642 | 256 |
| 98643 | 241 |
| 98644 | 242 |
| 98645 | 237 |
| 98647 | 249 |
| 98648 | 242 |
| 98649 | 237 |
| 98650 | 227 |
| 98651 | 246 |
| 98660 | 261 |
| 98661 | 265 |
| 98662 | 261 |
| 98663 | 262 |
| 98664 | 262 |
| 98665 | 261 |
| 98670 | 237 |
| 98671 | 258 |
| 98672 | 225 |
| 98673 | 226 |
| 98674 | 250 |
| 98675 | 261 |
| 98682 | 271 |
| 98683 | 266 |
| 98684 | 265 |
| 98685 | 263 |
| 98686 | 266 |
| 98801 | 221 |
| 98802 | 222 |
| 98811 | 250 |
| 98812 | 224 |
| 98813 | 221 |
| 98814 | 221 |
| 98815 | 222 |
| 98816 | 219 |
| 98817 | 223 |
| 98819 | 225 |
| 98821 | 223 |
| 98822 | 234 |
| 98823 | 218 |
| 98826 | 220 |
| 98827 | 235 |
| 98828 | 221 |
| 98830 | 224 |
| 98831 | 221 |
| 98832 | 219 |
| 98833 | 243 |
| 98834 | 224 |
| 98836 | 219 |
| 98837 | 216 |
| 98840 | 227 |
| 98841 | 228 |
| 98843 | 223 |
| 98844 | 228 |
| 98845 | 224 |
| 98846 | 222 |
| 98847 | 223 |
| 98848 | 216 |
| 98849 | 226 |
| 98850 | 220 |
| 98851 | 216 |
| 98852 | 228 |
| 98853 | 217 |
| 98855 | 228 |
| 98856 | 220 |
| 98857 | 214 |
| 98858 | 223 |
| 98859 | 232 |
| 98862 | 233 |
| 98901 | 230 |
| 98902 | 233 |
| 98903 | 228 |
| 98908 | 228 |
| 98920 | 227 |
| 98922 | 226 |
| 98923 | 229 |
| 98925 | 228 |
| 98926 | 221 |
| 98930 | 225 |
| 98932 | 221 |
| 98933 | 231 |
| 98935 | 226 |
| 98936 | 223 |
| 98937 | 228 |
| 98938 | 226 |
| 98939 | 229 |
| 98940 | 222 |
| 98941 | 223 |
| 98942 | 228 |
| 98943 | 225 |
| 98944 | 224 |
| 98946 | 230 |
| 98947 | 228 |
| 98948 | 227 |
| 98950 | 224 |
| 98951 | 227 |
| 98952 | 227 |
| 98953 | 224 |
| 99001 | 234 |
| 99003 | 241 |
| 99004 | 229 |
| 99005 | 244 |
| 99006 | 236 |
| 99008 | 226 |
| 99009 | 242 |
| 99011 | 236 |
| 99012 | 228 |
| 99013 | 230 |
| 99016 | 227 |
| 99017 | 218 |
| 99018 | 233 |
| 99019 | 227 |
| 99020 | 229 |
| 99021 | 241 |
| 99022 | 233 |
| 99023 | 231 |
| 99025 | 233 |
| 99026 | 240 |
| 99027 | 227 |
| 99029 | 227 |
| 99030 | 228 |
| 99031 | 231 |
| 99032 | 229 |
| 99033 | 220 |
| 99034 | 237 |
| 99036 | 233 |
| 99037 | 231 |
| 99039 | 227 |
| 99040 | 241 |
| 99101 | 234 |
| 99102 | 222 |
| 99103 | 224 |
| 99104 | 222 |
| 99105 | 220 |
| 99107 | 228 |
| 99109 | 228 |
| 99110 | 233 |
| 99111 | 215 |
| 99113 | 226 |
| 99114 | 229 |
| 99115 | 220 |
| 99116 | 224 |
| 99117 | 221 |
| 99118 | 232 |
| 99119 | 232 |
| 99121 | 235 |
| 99122 | 223 |
| 99123 | 216 |
| 99124 | 227 |
| 99125 | 215 |
| 99126 | 231 |
| 99128 | 222 |
| 99129 | 227 |
| 99130 | 219 |
| 99131 | 233 |
| 99133 | 221 |
| 99134 | 226 |
| 99135 | 222 |
| 99136 | 214 |
| 99137 | 229 |
| 99138 | 235 |
| 99139 | 231 |
| 99140 | 228 |
| 99141 | 230 |
| 99143 | 217 |
| 99144 | 223 |
| 99146 | 228 |
| 99147 | 226 |
| 99148 | 238 |
| 99149 | 240 |
| 99150 | 234 |
| 99151 | 229 |
| 99152 | 229 |
| 99153 | 233 |
| 99154 | 225 |
| 99155 | 228 |
| 99156 | 238 |
| 99157 | 231 |
| 99158 | 217 |
| 99159 | 227 |
| 99160 | 234 |
| 99161 | 217 |
| 99163 | 214 |
| 99164 | 222 |
| 99166 | 234 |
| 99167 | 236 |
| 99169 | 218 |
| 99170 | 220 |
| 99171 | 221 |
| 99173 | 237 |
| 99174 | 240 |
| 99176 | 217 |
| 99179 | 222 |
| 99180 | 227 |
| 99181 | 235 |
| 99185 | 225 |
| 99201 | 248 |
| 99202 | 244 |
| 99203 | 242 |
| 99204 | 245 |
| 99205 | 246 |
| 99206 | 232 |
| 99207 | 247 |
| 99208 | 242 |
| 99212 | 232 |
| 99216 | 233 |
| 99217 | 238 |
| 99218 | 241 |
| 99223 | 237 |
| 99224 | 233 |
| 99251 | 244 |
| 99258 | 242 |
| 99301 | 224 |
| 99320 | 218 |
| 99321 | 235 |
| 99322 | 226 |
| 99323 | 223 |
| 99324 | 228 |
| 99326 | 221 |
| 99328 | 220 |
| 99329 | 222 |
| 99330 | 221 |
| 99333 | 214 |
| 99335 | 230 |
| 99336 | 224 |
| 99337 | 220 |
| 99338 | 224 |
| 99341 | 223 |
| 99343 | 220 |
| 99344 | 223 |
| 99345 | 227 |
| 99346 | 225 |
| 99347 | 223 |
| 99348 | 223 |
| 99349 | 220 |
| 99350 | 221 |
| 99352 | 219 |
| 99353 | 217 |
| 99354 | 216 |
| 99356 | 222 |
| 99357 | 218 |
| 99360 | 224 |
| 99361 | 222 |
| 99362 | 222 |
| 99363 | 221 |
| 99371 | 220 |
| 99401 | 225 |
| 99402 | 220 |
| 99403 | 218 |
USAA and Nationwide offer the cheapest insurance across almost every ZIP code. Although these are average rates and your insurance rates in Washington State will depend on your case, these Washington auto insurance companies may be worth checking out.
Finding the Best Car Insurance Company in Washington
The best car insurance in Washington comes from Farmers, Travelers, and Allstate. Farmers offers customizable policies starting at $44 monthly. Travelers has an A++ financial strength rating, and Allstate offers an impressive 25% bundling discount.
Seeking quotes from various providers is a wise decision when you are buying car insurance. Comparing quotes is the easiest way to find affordable car insurance. Simply enter your ZIP code into our free comparison tool to see rates in your area.
Frequently Asked Questions
What is the best car insurance in Washington State?
The best car insurance in Washington State depends on your needs, but top providers include Farmers, Travelers, and Allstate, offering competitive rates and excellent coverage options.
Is car insurance more expensive in Washington?
The average cost of car insurance in Washington State is around $100 per month, but rates vary based on factors like driving history, location, and coverage level. Take the first step toward cheaper car insurance rates. Enter your ZIP code to see how much you could save.
How can I find cheap car insurance in Washington?
To get the cheapest Washington car insurance, compare multiple quotes from top-rated providers, maintain a clean driving record, and look for discounts. Learn how to lower your car insurance costs for more information.
What is the minimum car insurance required in Washington State?
Car insurance in Washington State requires a minimum liability coverage of 25/50/10, meaning $25,000 for bodily injury per person, $50,000 per accident, and $10,000 for property damage.
Which companies offer the cheapest car insurance in Washington State?
Geico, Progressive, and USAA often provide the cheapest car insurance in Washington State, depending on your profile and discounts. See how much you’ll pay for car insurance by entering your ZIP code into our free comparison tool.
What factors affect car insurance rates in Washington?
The average cost of car insurance in Washington depends on factors like age, driving history, vehicle type, coverage limits, and ZIP code. For comprehensive insights, explore our guide to car insurance basics.
Is auto insurance required in Washington State?
Yes, auto insurance in Washington is mandatory, and drivers must carry proof of insurance to comply with state laws.
How do I get car insurance quotes in Washington?
To get car insurance quotes in Washington state, enter your ZIP code into our free comparison tool to see how much car insurance costs in your area.
Who offers the best auto insurance in Washington State?
The best auto insurance in Washington State comes from providers like State Farm, Farmers, and Travelers, which offer strong financial ratings and customer satisfaction. Explore essential safe driving tips for Washington.
Can I get a discount on car insurance in WA?
Many car insurance companies in Washington offer discounts for bundling policies, being a safe driver, or maintaining a good credit score, helping you lower your car insurance WA costs.
Related Articles
-
Mar 2025

Dairyland Car Insurance Review for 2026 [See if They’re a Good Fit]
-
Mar 2025
Anchor General Car Insurance Review for 2026 [See Cost & Options Here!]
-
May 2025
Allstate vs. USAA Car Insurance in 2026 [Head-to-Head: Discounts & Coverage]
-
Jun 2025
Best Car Insurance in Massachusetts for 2026 [Top 10 MA Companies]
-
Mar 2025
Root Car Insurance Review for 2026 [Expert Evaluation]


Get a FREE Quote in Minutes
Insurance rates change constantly — we help you stay ahead by making it easy to compare top options and save.