


Houston, TX Car Insurance Guide (Comprehensive)
Free Car Insurance Comparison
Compare Quotes From Top Companies and Save
Eric Stauffer
Licensed Insurance Agent
Eric Stauffer is an insurance agent and banker-turned-consumer advocate. His priority is educating individuals and families about the different types of insurance coverage. He is passionate about helping consumers find the best coverage for their budgets and personal needs. Eric is the CEO of C Street Media, a full-service marketing firm and the co-founder of ProperCents.com, a financial educat...
Licensed Insurance Agent
UPDATED: Mar 13, 2025
It’s all about you. We want to help you make the right coverage choices.
Advertiser Disclosure: We strive to help you make confident car insurance decisions. Comparison shopping should be easy. We are not affiliated with any one car insurance company and cannot guarantee quotes from any single provider.
Our insurance industry partnerships don’t influence our content. Our opinions are our own. To compare quotes from many different companies please enter your ZIP code on this page to use the free quote tool. The more quotes you compare, the more chances to save.
Editorial Guidelines: We are a free online resource for anyone interested in learning more about car insurance. Our goal is to be an objective, third-party resource for everything car insurance related. We update our site regularly, and all content is reviewed by car insurance experts.
| Houston City Statistics | Details |
|---|---|
| City Population | 2,312,717 |
| City Density | 3,991 people per square mile |
| Average Cost of Car Insurance in Houston | $6,254.85 |
| Cheapest Car Insurance Company | USAA |
| Road/Pavement Conditions | Poor Share – 24% Mediocre Share – 28% Fair Share – 11% Good Share – 38% Vehicle Operating Costs – $610 |
Who says bigger is better? Texas, that’s who!
You may be wondering though, especially those of you in the Houston area, what is the best car insurance coverage for you? Sitting down and researching all of the information you’ll need to know to make the best decision can be a huge pain. But never fear, that’s where we come in.
We’ve put together this comprehensive guide for Houston citizens to help you make the best decision for your car insurance needs! Keep reading to find out more. If you want to see how Houston compares to finding car insurance in Texas or finding cheap car insurance in Dallas, we’ve got you covered there as well.
If you’re ready to dive into the car insurance pool and start comparing today, don’t forget to use our FREE online tool. All you need is your ZIP code.
How Much Does Auto Insurance Cost?
Let’s kick off this guide by discussing what exactly you can expect to pay in Houston for your car insurance.
We’ll cover topics on the demographic rates you can expect to see, as well as what you can expect to pay for the specific area in Houston you live in.
Free Insurance Comparison
Compare Quotes From Top Companies and Save
Do Gender and Age Affect my Car Insurance in Houston?
What demographic you fall into can play a higher role than you may think in what your auto insurance rates will be. It’s an unfortunate fact, but what group you fall into will determine if you pay more or less for your car insurance coverage.
The first demographic we’ll touch on is your age.
| Age | Rate |
|---|---|
| 17 years old | $9,393.23 |
| 25 years old | $3,794.62 |
| 35 years old | $3,018.83 |
| 60 years old | $2,876.24 |
| Cheapest Age – 60 years old | Cheapest Rate – $2,876.24 |
According to recent studies from the Insurance Information Institute (III), the age demographic who tends to pay the most for their insurance coverage is likely to be teens, as you can see from the table above. This can be due to a number of different facts, although the most common explanation for this has to do with the experience level of the driver.
Your gender, however, doesn’t get to have this excuse. But this is another common demographic that can differ in price range depending on where you live.
A common myth in the car insurance world is that men tend to pay more for their coverage than women do, so we did some research to see if this was true.
In the Houston area, women typically pay about $4,500.91, while men typically pay around $4,770.73.
Women do pay less in Houston, supporting this pretty common myth. This isn’t always the case, but it certainly is for those of you living in the Houston area.
The last demographic group we’ll touch on in this section is based on your marital status — whether you are married or single.
| Demographics | Rates |
|---|---|
| Married 60-year-old female | $2,791.00 |
| Married 60-year-old male | $2,961.47 |
| Married 35-year-old female | $2,969.61 |
| Married 35-year-old male | $3,068.06 |
| Single 25-year-old female | $3,683.32 |
| Single 25-year-old male | $3,905.93 |
| Single 17-year-old female | $8,559.72 |
| Single 17-year-old male | $10,226.74 |
| Average | $4,770.73 |
As you can see from the table above, those of you who are married in the Houston area will tend to pay a little less than those who are not.
What Are the Cheapest ZIP codes in Houston?
Where is the cheapest ZIP code in Houston, and where is the most expensive? Check out the table below to find out if where you live in Houston is on the more expensive side or on the cheaper side.
| ZIP Code | Average Annual Rate |
|---|---|
| 77059 | $6,254.85 |
| 77062 | $6,263.54 |
| 77058 | $6,308.38 |
| 77339 | $6,351.62 |
| 77079 | $6,441.61 |
| 77005 | $6,459.12 |
| 77094 | $6,513.47 |
| 77598 | $6,523.91 |
| 77336 | $6,538.79 |
| 77006 | $6,550.05 |
| 77098 | $6,594.26 |
| 77069 | $6,608.68 |
| 77046 | $6,623.26 |
| 77070 | $6,655.34 |
| 77025 | $6,664.14 |
| 77089 | $6,714.46 |
| 77007 | $6,724.72 |
| 77027 | $6,740.78 |
| 77056 | $6,743.45 |
| 77030 | $6,751.63 |
| 77024 | $6,766.97 |
| 77018 | $6,787.86 |
| 77489 | $6,794.35 |
| 77064 | $6,795.54 |
| 77068 | $6,797.24 |
| 77096 | $6,824.63 |
| 77095 | $6,824.84 |
| 77043 | $6,824.99 |
| 77015 | $6,843.82 |
| 77054 | $6,843.85 |
| 77338 | $6,847.41 |
| 77077 | $6,852.84 |
| 77019 | $6,856.66 |
| 77049 | $6,872.59 |
| 77008 | $6,881.81 |
| 77009 | $6,915.07 |
| 77055 | $6,931.67 |
| 77031 | $6,939.89 |
| 77080 | $6,946.18 |
| 77092 | $6,950.09 |
| 77063 | $6,965.40 |
| 77034 | $6,970.03 |
| 77041 | $6,970.77 |
| 77002 | $6,994.51 |
| 77057 | $7,042.73 |
| 77065 | $7,044.17 |
| 77029 | $7,052.00 |
| 77035 | $7,053.81 |
| 77085 | $7,102.58 |
| 77084 | $7,112.24 |
| 77042 | $7,117.06 |
| 77021 | $7,149.81 |
| 77075 | $7,189.45 |
| 77044 | $7,214.79 |
| 77010 | $7,224.35 |
| 77082 | $7,227.39 |
| 77013 | $7,229.21 |
| 77032 | $7,242.29 |
| 77066 | $7,257.08 |
| 77011 | $7,286.14 |
| 77003 | $7,313.08 |
| 77071 | $7,325.02 |
| 77073 | $7,327.59 |
| 77087 | $7,329.81 |
| 77074 | $7,337.34 |
| 77040 | $7,345.76 |
| 77012 | $7,347.90 |
| 77047 | $7,389.06 |
| 77023 | $7,399.43 |
| 77014 | $7,408.80 |
| 77045 | $7,420.16 |
| 77017 | $7,427.19 |
| 77090 | $7,441.20 |
| 77086 | $7,471.65 |
| 77061 | $7,479.15 |
| 77048 | $7,486.87 |
| 77051 | $7,489.43 |
| 77201 | $7,492.29 |
| 77204 | $7,496.11 |
| 77004 | $7,497.22 |
| 77050 | $7,505.14 |
| 77020 | $7,514.53 |
| 77026 | $7,553.90 |
| 77038 | $7,567.20 |
| 77028 | $7,579.76 |
| 77093 | $7,592.70 |
| 77099 | $7,600.09 |
| 77039 | $7,601.85 |
| 77022 | $7,605.82 |
| 77081 | $7,609.75 |
| 77088 | $7,612.47 |
| 77067 | $7,613.31 |
| 77016 | $7,629.02 |
| 77091 | $7,644.01 |
| 77060 | $7,664.73 |
| 77037 | $7,670.41 |
| 77083 | $7,670.98 |
| 77076 | $7,684.94 |
| 77078 | $7,700.94 |
| 77053 | $7,747.72 |
| 77033 | $7,840.97 |
| 77072 | $7,909.04 |
| 77036 | $8,150.71 |
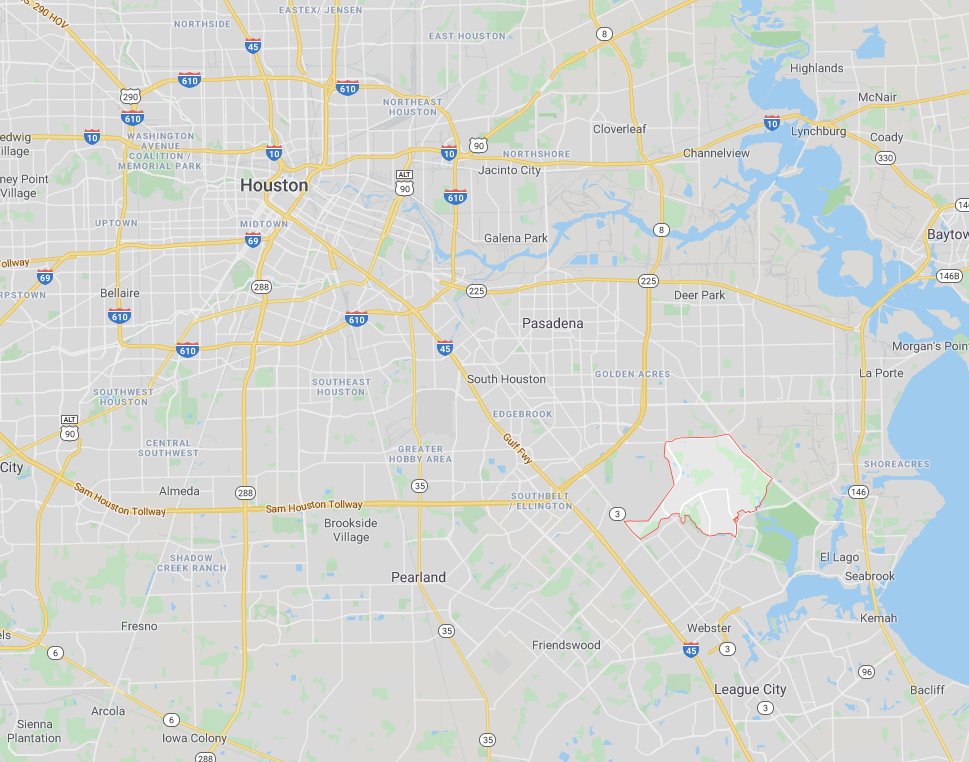
As you can see, the cheapest ZIP code in Houston is 77059. It is relatively cheaper because it’s farther away from the downtown area, indicated in the map below in the red outlined area.
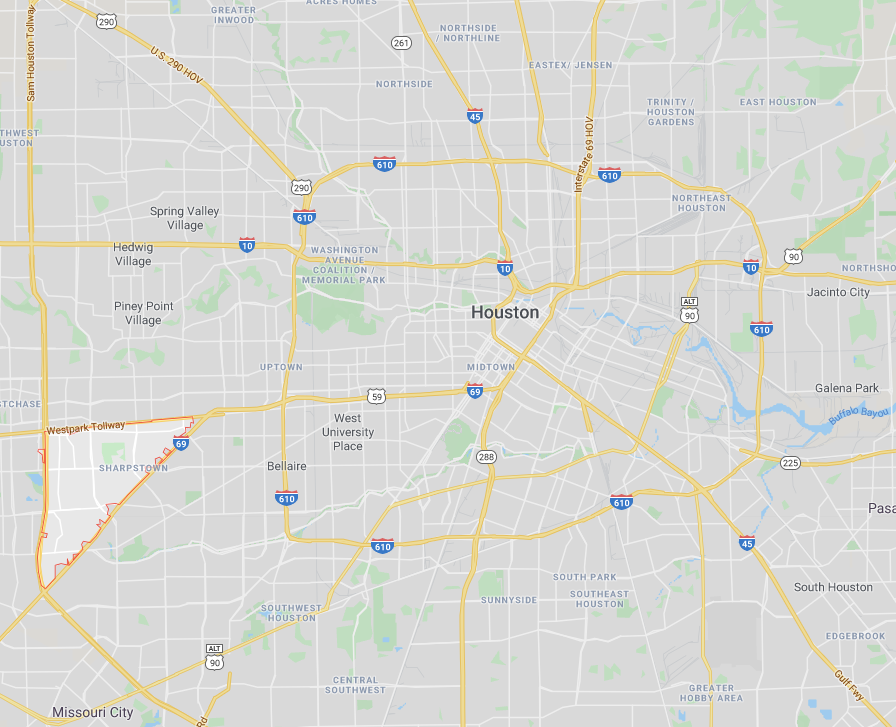
This is compared to the most expensive ZIP code in Houston, which is 77036.
As you can see from the image below (indicated in the red outlined area), it’s much closer to the downtown area, which is where car insurance prices start to get more expensive.
What’s the Best Car Insurance Company in Houston?
Which company is going to give you more bang for your buck? Who’s going to give you the best protection, and who’s going to charge you more for certain things?
Let’s find out below.
Free Insurance Comparison
Compare Quotes From Top Companies and Save
What Are the Cheapest Car Insurance Rates by Company?
Let’s start this section with the bigger picture: what exactly can you expect to pay from some of the largest car insurance providers in the Houston area? Check out the table below to find out.
| Group | Single 17-Year-Old Female | Single 17-Year-Old Male | Single 25-Year-Old Female | Single 25-Year-Old Male | Married 35-Year-Old Female | Married 35-Year-Old Male | Married 60-Year-Old Female | Married 60-Year-Old Male | Average |
|---|---|---|---|---|---|---|---|---|---|
| Allstate | $11,218.58 | $13,508.79 | $5,202.14 | $5,400.52 | $4,217.27 | $4,244.40 | $4,163.30 | $4,163.30 | $6,514.79 |
| American Family | $11,317.80 | $14,803.09 | $5,781.26 | $6,621.66 | $3,868.87 | $4,362.69 | $3,710.26 | $4,306.92 | $6,846.57 |
| Geico | $6,541.74 | $6,741.68 | $3,158.48 | $3,120.96 | $2,912.28 | $3,169.25 | $2,838.28 | $3,271.55 | $3,969.28 |
| Nationwide | $7,905.73 | $10,151.58 | $3,231.22 | $3,497.33 | $2,737.94 | $2,781.67 | $2,414.89 | $2,556.62 | $4,409.62 |
| Progressive | $11,780.27 | $13,178.71 | $3,311.60 | $3,372.89 | $2,780.15 | $2,646.22 | $2,470.71 | $2,516.22 | $5,257.10 |
| State Farm | $5,837.21 | $7,446.90 | $2,624.53 | $2,699.21 | $2,409.57 | $2,409.57 | $2,150.86 | $2,150.86 | $3,466.09 |
| USAA | $5,316.68 | $5,756.42 | $2,474.00 | $2,628.93 | $1,861.20 | $1,862.59 | $1,788.73 | $1,764.79 | $2,931.67 |
So as you can see, the overall cheapest insurance rates are going to be for older married males with USAA at $1,764.79, while the most expensive overall company rates are going to be for teenage males with Progressive at $13,178.71.
What Is the Best Car Insurance for Commute Rates?
Did you know how far you commute on a regular basis can actually cost you extra, depending on who your provider is?
| Group | 10-Mile Commute, 6,000 Annual Mileage | 25-Mile Commute, 12,000 Annual Mileage | Average |
|---|---|---|---|
| Allstate | $6,353.51 | $6,676.06 | $6,514.79 |
| American Family | $6,846.57 | $6,846.57 | $6,846.57 |
| Geico | $3,895.17 | $4,043.38 | $3,969.28 |
| Nationwide | $4,409.62 | $4,409.62 | $4,409.62 |
| Progressive | $5,257.10 | $5,257.10 | $5,257.10 |
| State Farm | $3,466.09 | $3,466.09 | $3,466.09 |
| USAA | $2,894.35 | $2,968.99 | $2,931.67 |
As you can see, providers in Houston such as Allstate, Geico, and USAA will charge you more for your coverage if you have a longer commute.
What is the Best Car Insurance for Coverage Level Rates?
How would you feel if we told you that you could be paying more money for a coverage plan that gives you less protection?
Probably not very good, right? Well, if you’re not careful and not comparing your insurance rates, that’s exactly what could happen.
| Group | High | Medium | Low | Average |
|---|---|---|---|---|
| Allstate | $6,747.80 | $6,451.07 | $6,345.48 | $6,514.78 |
| American Family | $7,693.82 | $6,550.06 | $6,295.82 | $6,846.57 |
| Geico | $4,275.87 | $3,908.95 | $3,723.01 | $3,969.28 |
| Nationwide | $4,269.74 | $4,219.83 | $4,739.31 | $4,409.63 |
| Progressive | $5,526.99 | $5,234.74 | $5,009.56 | $5,257.10 |
| State Farm | $3,675.87 | $3,453.47 | $3,268.93 | $3,466.09 |
| USAA | $3,063.36 | $2,917.54 | $2,814.10 | $2,931.67 |
Using the data above, if you were to get a low coverage plan with American Family, you’d be paying $6,295.82. Meanwhile, as you can see above, you could get a high coverage plan with Geico for only $4,275.87.
That means you’d be paying $2,019.95 more for a coverage plan that won’t give you the best coverage.
Free Insurance Comparison
Compare Quotes From Top Companies and Save
What is the Best Car Insurance for Credit History Rates?
Car insurance based on your credit history? Yes, you read that right. Auto insurance companies typically will check your credit history before they offer you coverage, and those with poor credit will pay more.
| Group | Good | Fair | Poor | Average |
|---|---|---|---|---|
| Allstate | $5,193.73 | $6,064.69 | $8,285.94 | $6,514.79 |
| American Family | $5,253.86 | $6,015.71 | $9,270.13 | $6,846.57 |
| Geico | $2,293.67 | $3,462.39 | $6,151.78 | $3,969.28 |
| Nationwide | $3,684.52 | $4,248.38 | $5,295.97 | $4,409.62 |
| Progressive | $4,736.52 | $5,113.92 | $5,920.85 | $5,257.10 |
| State Farm | $2,439.19 | $3,057.10 | $4,901.97 | $3,466.09 |
| USAA | $2,013.20 | $2,496.22 | $4,285.58 | $2,931.67 |
So needless to say from the data above, the worse your credit history is, the higher your insurance rates are going to be.
However, credit history rates may soon be a thing of the past. A lot of states, such as Massachusetts, are going to start prohibiting car insurance providers from using your credit history to determine your rates.
Until such a time, however, be sure to keep on top of your credit history, as it’s one sure-fire way to make sure you can lower your rates.
What is the Best Car Insurance for Driving Record Rates?
The same principle behind checking your credit history also applies to checking your driving record. Those with a clean record will get the cheapest auto insurance.
| Group | Clean Record | With One Speeding Violation | With One Accident | With One DUI | Average |
|---|---|---|---|---|---|
| Allstate | $5,026.59 | $5,026.59 | $7,838.42 | $8,167.54 | $7,010.85 |
| American Family | $6,204.20 | $6,204.20 | $7,997.66 | $6,980.21 | $7,060.69 |
| Geico | $3,360.70 | $4,339.34 | $4,480.89 | $3,696.17 | $3,845.92 |
| Nationwide | $3,820.09 | $4,319.57 | $3,820.09 | $5,678.74 | $4,439.64 |
| Progressive | $4,576.28 | $5,159.92 | $5,935.65 | $5,356.54 | $5,289.49 |
| State Farm | $3,071.33 | $3,071.33 | $3,533.51 | $4,188.19 | $3,597.68 |
| USAA | $2,174.69 | $2,498.87 | $3,238.80 | $3,814.31 | $3,075.93 |
As you can see above, even having one ticket on your driving record can drive up your insurance rates. Finding affordable car insurance is much easier if you’re a safe driver with a clean record.
What Are Some Car Insurance Factors in Houston?
Did you know that there are other factors that go into your car insurance rates that have nothing to do with you, but where you live? That’s right, where you live will affect your car insurance rates.
Keep reading to find out what factors will affect your car insurance rates for those of you in Houston.
Free Insurance Comparison
Compare Quotes From Top Companies and Save
Houston Metro Report
What other kinds of information should you know about the Houston area? The Brookings Institution’s annual Metro Monitor Report is a great place to start.
It helps to give an idea as to what kind of growth the Houston area is experiencing, which can translate to how much traffic you might see on the road around you.
So, what kind of information does this report show?
The Metro Monitor Report displays the growth, prosperity, inclusion, and growth on the top 100 city regions in the nation. This information shows the trends over the past year, the past five years, and the past 10 years.
All this data is then broken down to give a ranking for that region and how it compares to all the other cities in the nation.
How does Houston rank? According to the Metro Monitor Report, Houston has the following data:
- Prosperity – 95th of 100
- Productivity – -0.4 percent (86th of 100)
- Standard of living – -0.9 percent (96th of 100)
- Average annual wage – -0.4 percent (98th of 100)
- Growth – 85th of 100
- Jobs – +0.9 percent (71st of 100)
- Gross metropolitan product (GMP) – +0.4 percent (91st of 100)
- Jobs at young firms – +0.8 percent (76th of 100)
What does all this data mean? It means that Houston needs some help in the prosperity department, as things such as productivity, the standard of living, and the average annual wage are decreasing.
Considering how huge the Houston area is and how populated the area is, this information isn’t too surprising.
What Is the Median Household Income in Houston?
The good news is that despite the data listed in the previous section, Houston citizens are doing better than previous years for their median household income.
According to Data USA, the median household income for Houston citizens is $33,552. This is an increase of 3.45 percent from the previous year.
How does this translate to your car insurance coverage? The average auto insurance premium in Texas is about $528.75. Houston citizens are paying about 1.58 percent of this income for insurance coverage.
Ensuring that you store this amount away so that you can pay for your insurance coverage is going to be key.
What Is the Percentage of Homeownership in Houston?
Knowing how many people own their homes in your area will help give you a better idea of the number of permanent Houston drivers you’ll see in your area.
So what kind of homeownership can you expect to see in the Houston area?
About 68.7 percent of the population in Houston owned their own homes in 2017, according to Data USA.
This sounds really good, but in actuality, this is a decrease from 2016, in which about 70.4 percent owned their own homes in the Houston area. Why might this be?
It could be due to the fact that the average property value has increased from about $77,400 to $80,200, meaning that houses are going to be more expensive to buy in the area.
This speaks volumes, however, as this means that it’s a seller’s market. There are fewer new people coming into the area, so there will be fewer people on the roads.
Free Insurance Comparison
Compare Quotes From Top Companies and Save
What Is Education in Houston like?
Better education in your area may mean more people and more drivers in your area. So what kind of educational opportunities can you expect to see in Houston?
For those of you out there looking for higher education, you have a few establishments located conveniently in Houston itself, such as the University of Houston, Houston Community College, and the University of Houston-Downtown. At these universities and colleges, the following major concentrations are the most popular:
| Education Level | Most (#1) Common Concentration | Number of Degrees Awarded | Second Most Common Concentration | Number of Degrees Awarded | Third Most Common Concentration | Number of Degrees Awarded |
|---|---|---|---|---|---|---|
| <1 Year Postsecondary Certificate | Quality Control and Safety Technology | 202 | Dental Assisting | 194 | Welding Technology | 308 |
| 1–2 Year Postsecondary Certificate | General Cosmetology | 438 | Dental Assisting | 373 | Medical Assistant | 1,814 |
| Associate's Degree | General Business Administration and Management | 254 | Registered Nursing | 147 | General Studies | 5,048 |
| 2–4 Year Post-secondary Certificate | Diesel Mechanics Technology | 202 | Auto-body and Collision Repair Technology | 156 | Automobile Mechanics Technology | 544 |
| Bachelor's Degree | General Psychology | 825 | General Business Administration and Management | 772 | Other Multidisciplinary Studies | 909 |
| Post-baccalaureate Certificate | General Business Administration and Management | 216 | Other Theology and Religious Vocations | 0 | N/A | N/A |
| Master's Degree | General Business Administration and Management | 1,133 | Accounting | 206 | Curriculum and Instruction | 202 |
| Post-Master's Certificate | Orthodontics | 7 | Maxillofacial Surgery | 6 | Endodontics | 5 |
| Research Doctorate | General Education Leadership and Administration | 62 | General Chemistry | 49 | Bio-engineering and Biomedical Engineering | 37 |
| Professional Doctorate | Law | 739 | Medicine | 423 | Pharmacy | 199 |
What Is the Percentage of Wage by Race and Ethnicity in Common Jobs in Houston?
Based on this education received, what can Houston citizens expect to receive in terms of wages? We’ve broken up exactly what you can expect to receive in this section based on your race and ethnicity in Houston.
In the table below, we’ll show the most recent data from Data USA about wages based on race and ethnicity in miscellaneous manager positions in Texas:
| Race | Average Wage | People in Workforce | Percentage of Income Spent on Car Insurance |
|---|---|---|---|
| Asian | $114,787 | 21,930 | 5.4% |
| White | $108,155 | 236,227 | 5.7% |
| Two or More Races | $82,011 | 5,343 | 7.6% |
| American Indian | $80,546 | 704 | 7.7% |
| Black | $73,953 | 29,081 | 8.4% |
| Other | $60,179 | 10,895 | 10.3% |
People who earn more will have a lower percentage of their income going towards car insurance. For example, Asians are the highest-paid miscellaneous managers and only spend 5.4 percent of their income on car insurance, but the lowest-paid race/ethnicity spends over 10 percent.
What Is the Percentage of Wage by Gender in Common Jobs in Houston?
Unfortunately, just like with your race and ethnicity, your gender also can affect what type of wages you’ll get. To no one’s big surprise, men get paid more than women in the Houston area.
On average, men get paid $64,953, while women only receive an average of $45,959.
This only further solidifies the wage gap, with such a large difference in the average wage between men and women.
Free Insurance Comparison
Compare Quotes From Top Companies and Save
What Is the Percentage of Poverty by Age and Gender in Houston?
Now let’s flip the income coin and take a peek at what poverty looks like for the Houston region.
No region wants to have a high average of those living in poverty, but the unfortunate truth is that most highly populated metropolitan areas tend to see higher-than-average poverty levels.
This is certainly the case for the city of Houston.
The national average of people who live below the poverty line is 13.4 percent. In Houston alone, that population is 24.7 percent, putting the city well above the national average.
The largest demographic of those living in poverty are women between the age of 18 and 24.
What Is the Percentage of Poverty by Age and Gender in Houston?
Let’s divide this up even further based on race and ethnicity. From Data USA. The information below shows the numbers of those living in poverty for each race and ethnicity.
- White – 2,101
- Black – 2,001
- Hispanic – 879
According to this data, the largest demographic of those in poverty are white, but only by a small margin, as the next highest demographic is for black citizens.
What Is the Percentage of Employment by Occupations in Houston?
This poverty data, while alarming, seems to align with the Metro Monitor Report data listed in a previous section. Just from 2016 to 2017, the employment rate declined by 4.84 percent, meaning that the number of employed people in the Houston area went from 8,003 to only 7,640.
With numbers like this, the poverty level is only going to increase.
There is a silver lining in all of this, however. Job growth seems to be back on the rise. What does this mean for those looking for employment? It means that they can expect to see more job opportunities available to them.
But what kinds of jobs can people expect to see opportunities in? Based on the following common job categories, you can expect to see more jobs in these areas:
- Office and administrative support occupations – 864 people
- Sales and related occupations – 826 people
- Production occupations – 814 people
So if you’re looking for employment in the Houston area, you can expect to start seeing an increase in these areas.
Free Insurance Comparison
Compare Quotes From Top Companies and Save
What’s Driving in Houston like?
Now that we’ve gone over some of the contributing factors of living in the Houston area, let’s look at driving in the city. We’ll discuss the roads in Houston and what you can expect when you go out for a drive.
What Are the Major Roads in Houston?
In this section, we’ll briefly touch on some of the major highways you can expect to see in Houston, the road conditions you’ll experience, and even whether you’ll find speeding or red-light cameras while driving.
What Are the Major Highways in Houston?
Typically, the quickest and most convenient way to get around the city is to travel on the various highways available.
In the entire state of Texas, there are about 25 active routes with 3,501.15 miles of road. Texas is one of the largest states in the country, so this isn’t very surprising.
The following highways are active in the state of Texas:
- I-2, I-10, I-14, I-20, I-27, I-30, I-35, I-35E, I-35W, I-37, I-40, I-44, I-45, I-69, I-110, I-410, I-610, I-820, I-635, I-345, I-69C, I-69E, I-69W, I-169, I-369
Of these roads, those of you living in Houston will be using the following highways:
- I-10
- I-35
- I-45
- I-69
- I-410
- I-610
- I-345
I-10, in particular, is one of the largest roadways in the state, so you can expect to see a lot more traffic here than on any highway in Houston.
Free Insurance Comparison
Compare Quotes From Top Companies and Save
What Are the Popular Road Trips/Sites?
Looking for a little R&R? Well, you found the right place in Houston. A few of the most popular attractions for tourists to visit in Houston are as follows:
- Downtown Tunnels
- Gerald D. Hines Waterwall Park
- The Houston Zoo
- JP Morgan Chase Tower
- BAPS Shri Swaminarayan Temple
- Discovery Green
- Camino Market
Make sure to check out the video below as well for a full vacation guide from Expedia on Houston.
Once you’ve explored popular sites in Houston, you can take a few road trips around Texas to experience even more.
- Abandoned Places Road Trip – This trip takes you to the creepiest abandoned places in Texas.
- Christmas Lights Road Trip – If you love Christmas, this trip is for you.
- Haunted Road Trip – Unlike the abandoned places road trip, the spots on this trip are considered haunted.
- Lighthouse Road Trip – Take this trip to see the ocean and some historical lighthouses.
Texas is a vast state, which means there is always something to do in both Houston and the surrounding areas.
What Are the Road Conditions like?
No one likes it when road conditions are poor. It makes for a bumpier, more uncomfortable driving experience, on top of the fact that it can seriously damage your car.
The National Transportation Research Group conducted a study to find out what the typical road conditions were like in various urban cities in the country and see just how much more drivers have to pay for operating costs because of those conditions.
According to this study, the following road conditions can be seen across the city of Houston:
- Poor – 24 percent
- Mediocre – 28 percent
- Fair – 11 percent
- Good – 38 percent
- Vehicle operating costs – $610
This means that while it may look like a majority of roads are in good condition; the combined categories of poor and mediocre road conditions mean that Houston has some work to do to improve their roads.
Does Houston Use Speeding or Red-light Cameras?
No.
According to the IIHS, the city of Houston has a ban on the use of cameras, as you can see from the video below.
Free Insurance Comparison
Compare Quotes From Top Companies and Save
What Type of Vehicles Are in Houston?
What types of vehicles should you expect in Houston? Is it like what you see in television shows and movies about Texas vehicles always being massive trucks? Or is there a larger population of eco-friendly vehicles commonly seen in larger cities these days?
In this section, we’ll dive into the vehicles in Houston, the most popular vehicles owned, and the number of vehicles that are stolen in the area.
What Are the Most Popular Vehicles Owned?
You’re out cruising the roads in Houston, and you look around you. What kind of vehicles are you going to see?
We have the answer to that, according to the results of a study done by YourMechanic to find out the most popular vehicle types in the largest metropolitan areas in the nation.
The following data was found in this study for the city of Houston:
- Most popular vehicle – F-250 Super Duty
- American-made vehicles – 47 percent
- Hybrid vehicles – 0.7 percent
- Subaru population – 0.5 percent
- Muscle cars – 18.5 percent
As you can see from the data above, it really is true what they say about Texas. Everything’s bigger, including the vehicles.
How Many Cars per Household
Based on all the information in the previous section, how does this translate to the number of cars per household?
According to Data USA, the national average of vehicles owned per household is two.
This average translates well to those in Houston, as Houston citizens also have an average of two vehicles per household.
Free Insurance Comparison
Compare Quotes From Top Companies and Save
How Many Households Without Cars?
But what about those without cars in the Houston area?
| Vehicle Ownership | 2015 | 2016 |
|---|---|---|
| Households without vehicles | 8.30% | 8.10% |
| Vehicles per household | 1.58 | 1.59 |
According to the table above, only about 8 percent of the population are without vehicles. The city of Houston is one of the most spread-out cities in the country, stretching across many miles of the state. So it would be much harder not to have some form of reliable transportation.
Are There any Speed Traps in Houston?
We’ve got some bad news. SpeedTrap.org listed Houston as the worst city for speed traps in the state of Texas. Some of the worst speed trap areas (according to Madrid Law Firm) are:
- Parker Road/Exeter
- Moorwick/Wickchester
- Wescott southbound (approaching Memorial Drive)
- Mykawa (between Airport and Belfort)
- Silverstone/Airport Blvd
Unless you want a pricey ticket and increased car insurance rates, don’t speed in Houston.
Is There a Vehicle Theft in Houston?
The last thing drivers want to have to worry about is whether their vehicle will be stolen. But it’s something that should be on all drivers’ radars.
According to a crime report conducted by the FBI, in 2013 alone, Houston had over 13,595 vehicles stolen.
That’s a pretty large margin of vehicles stolen.
To make matters worse, this data means that for every 1,000 citizens in Houston, five of those citizens will have their vehicle stolen. This is such a large margin, in fact, that Houston tops the list of cities with the most vehicle thefts in the entire state of Texas.
Free Insurance Comparison
Compare Quotes From Top Companies and Save
How is Traffic in Houston?
If you enjoy driving, chances are that traffic is one of the more frustrating aspects of it. If you’re living in the Houston area especially, you might have to learn to get used to it.
Is There a Traffic Congestion in Texas?
No one likes traffic, but for those of you who live in the Houston area, traffic is a pretty common occurrence — so much so that it ranks on three separate traffic index lists.
It’s not too surprising, as Houston is one of the largest cities in one of the largest states in the nation. But you’ll want to prepare yourself for it nonetheless.
According to TomTom,Houston has the following traffic data:
| TomTom Congestion in Houston | Details |
|---|---|
| World rank | 204 |
| Congestion level | 23% |
| Extra travel time in the morning | +13 min per 30-minute trip |
| Extra travel time in the evening | +18 min per 30-minute trip |
| Average morning/evening peak congestion | 42%/59% |
| Average highway/non-highway congestion | 22%/24% |
A congestion level of 23 percent means there is a 23 percent extra travel time for any trip, anywhere in the city, at any time, compared to what it would be in local, free-flow conditions.
While it may not seem very bad, being ranked as the 208th most congested city in the world is fairly high.
INRIX Scorecard has the following traffic congestion information for Houston:
| INRIX Scorecard for Houston | Details |
|---|---|
| 2018 Impact rank (2017) | 77 (82) |
| Hours lost in congestion | 98 (118) |
| Year-over-year change | 6% |
| Cost of congestion (per driver) | $1,365 |
| Inner city travel time (minutes) | 4 |
| Inner city last mile speed (mph) | 15 |
This information means that every driver pays about $1,365 per year due to traffic congestion in the Houston area.
Numbeo has Houston ranked as the sixth-most congested city in the nation, along with the following data:
| Numbeo Traffic Index for Houston, Texas | Details |
|---|---|
| Traffic Index | 208.54 |
| Time Index | 42.21 minutes |
| Inefficiency Index | 242.95 |
As you can see, according to Numbeo, the Houston traffic index is 208.54, which means traffic congestion in the area is higher than that of other cities in the nation.
What’s Transportation in Houston like?
Muddling through this traffic can be a hassle, so how does the typical Houston citizen get through it? Are they taking public transit? Driving alone? According to Data USA, Houston citizens are using the following transportation methods most:
- Drive alone – 85.5 percent
- Carpool – 8.35 percent
- Work at home – 3.84 percent
As you can see, the largest majority of Houston citizens prefer to drive alone. This data aligns well with all previous data on just how large the Houston area is.
Free Insurance Comparison
Compare Quotes From Top Companies and Save
How Safe are Houston’s Streets and Roads?
Above all else, we want to make sure drivers are safe on the road. Part of this is done by providing all of the fatality statistics we can to further arm you with the information you’ll want to know about your area.
From the data seen by the National Highway Transportation Safety Administration (NHSTA), the following fatality statistics can be found for the Houston area:
| Type of Fatality (2017) | Number of Fatalities |
|---|---|
| Single Vehicle Crash | 242 |
| Involving an Alcohol-Impaired Driver | 202 |
| Involving a Roadway Departure | 173 |
| Passenger Car Occupant | 149 |
| Involving an Intersection | 115 |
| Pedestrian | 109 |
| Involving Speeding | 105 |
| Light Truck and Van Occupant | 97 |
| Motorcyclist | 76 |
| Involving a Large Truck | 47 |
| Pedal-cyclist | 14 |
| Total Number of Crashes | 456 |
That’s a total of 456 fatalities while driving on Houston roads. That’s a large amount, even considering how big the city is.
Allstate America’s Best Drivers Report
The Allstate America’s Best Drivers Report is a list of the top cities in America where drivers are least likely to be involved in a car accident. There are many factors that go into the ranking that is given to each city, such as their population density and weather conditions.
The following table displays Houston’s ranking on this list:
| Allstate America’s Best Drivers Report | Details |
|---|---|
| Houston's Best Drivers Report Rank – 2018 | 164 |
| Average Years Between Claims | 6.9 |
| Relative Claim Likelihood (Compared to National Average) | 44.40% |
| 2018 Drivewise® Hard-Braking Events per 1/1,000 Miles | N/A |
| Houston's Best Drivers Report Rank – 2017 | 167 |
| Change in Ranking From 2017 to 2018 | + 3 |
| 2018 Ranking After Controlling for Population Density | 167 |
| 2018 Ranking After Controlling for Average Annual Precipitation | 156 |
| Suburban Metro Area Column | Houston-The Woodlands-Sugar Land |
| Average Years Between Claims (Suburban Metro Area) | 8 |
As you can see, Houston was ranked as the 164th-safest city in the nation to drive in.
Read more: America’s Safest Driving Cities
How Does Ridesharing Work?
If you don’t own a car, using rideshare services can quickly become expensive. However, comparing prices at competitors with sites like RideGuru can help you find an economical choice.
To give you a quick overview of how rideshare companies usually rank in terms of cost, we’ve listed companies from least to most expensive below.
- Taxi – Usually, a traditional taxi is the cheapest option in Houston.
- Lyft – This option costs a little more than a traditional taxi.
- Uber – Usually, Uber’s prices are similar to Lyft’s prices.
Uber and Lyft only cost a little more than a taxi, but this is only if you buy the basic rideshare options from these companies. If you upgrade to a luxury vehicle, costs will rise.
Free Insurance Comparison
Compare Quotes From Top Companies and Save
How to Reach E-star Repair Shops
As you probably already know, anything can happen when you’re driving — including needing repairs in a pinch. So what do you have available at your disposal if you never need a car repair?
The good news is that we’ve done the hard part for you by collecting information on some of the top-rated E-star repair shops in the Houston area.
An E-star repair shop is a highly ranked repair facility that is known as top-quality for both repairs and customer service.
If you ever need a repair shop in a pinch, check out the list below. The data below is based on the ZIP code 77002, for the downtown area.
| Name of E-star Repair Facility | Address | Contact Information | Distance (from 77002 ZIP code) |
|---|---|---|---|
| CARSTAR Premier | 9520 Richmond Ave. Houston, TX 77063 | email: [email protected] P: (713) 952-3777 | 10 miles |
| Charlton's Body Repair CF | 1131 Staffordshire Rd. Stafford, TX 77477 | email: [email protected] P: (281) 499-1126 F: (281) 499-1694 | 15 miles |
| Greenfield Collision Center | 15920 Kuykendahl Houston, TX 77068 | email: [email protected] P: (281) 580-1994 F: (281) 580-3205 | 19 miles |
| Miller Auto & Body Repair | 4816 N. Shepherd Houston, TX 77018 | email: [email protected] P: (713) 864-7820 F: (713) 864-6280 | 6 miles |
| Russell & Smith Ford Honda | 1109 South Loop W. Houston, TX 77054 | email: [email protected] P: (713) 663-4216 F: (713) 663-4110 | 5 miles |
| Service King Galleria | 5919 Westheimer Rd. Houston, TX 77057 | email: [email protected] P: (713) 243-1400 F: (713) 266-4316 | 7 miles |
| Service King Humble | 450 E. FM 1960 Humble, TX 77338 | email: [email protected] P: (281) 446-6660 F: (800) 214-2373 | 18 miles |
| Service King Pearland | 2330 Smith Ranch Road Pearland, TX 77584 | email: [email protected] P: (713) 795-3100 F: (800) 214-2373 | 13 miles |
| Service King Southwest Freeway | 10475 Southwest Freeway Houston, TX 77074 | email: [email protected] P: (713) 773-5000 F: (713) 772-1746 | 12 miles |
| Sunrise Paint & Body Inc. | 4211 Cook Rd. Houston, TX 77072 | email: [email protected] P: (281) 933-7473 F: (281) 933-9426 | 14 miles |
What Is the Weather like in Houston?
One fact a lot of people don’t think of when it comes to your car is the weather. But it has a bigger role than you might even think. Depending on where you live, you might see a particular range of temperatures, for instance.
If you live in an area that is known to be on the hotter side, you might experience more issues with your vehicle caused by the heat, while those who live in colder areas might see more issues caused by the lower temperatures.
So where exactly does Houston fall?
| Houston Weather Averages | Details |
|---|---|
| Annual high temperature | 78.3° |
| Annual low temperature | 59.8° |
| Average temperature | 69.05° |
| Average annual precipitation – rainfall | 45.28 inch |
| Days per year with precipitation – rainfall | 106 days |
| Annual hours of sunshine | 2633 hours |
| Average annual snowfall | N/A |
Houston tends to run on the hotter side, which makes sense as Texas is well known for its heat.
Do you know what else goes with extreme temperature? Natural disasters.
That’s right: Knowing what kind of natural disasters are prone to your area will help you better prepare your vehicle for those disasters — and to know what kind of insurance coverage you’ll need to best protect your vehicles in the case of those disasters.
According to City Data, the Houston area has reported a total of 22 major disasters, six of which were declared as national emergencies.
These disasters can be broken up into the following categories:
- Storms – six
- Floods – 15
- Hurricanes – 15
- Tornadoes – seven
- Tropical Storms – three
- Fires – two
- Wind Events – two
Houston lies fairly close to the coast, so it would make sense for the area to see more hurricanes and flooding than other cities located more inland. You can see in the video below exactly what a hurricane does to an area such as Houston.
Is Public Transit Available in Houston?
For those of you in the Houston area who do fall into that 8 percent margin without vehicles, you’ll be looking to utilize some of the public transit available to you. The good news for you is that you have a few options for the Houston area:
| Transportation Option | Cost | Routes/Details (if listed) |
|---|---|---|
| METRO Bus System | • Local Service Fare – $1.25 • One-Way Fare – ranges from $2–4.50 depending on distance | • Local services runs mostly on city streets • Park & Ride Service is for long-distance commuting • METRO's 28 Park & Ride lots provide bus service to key destinations |
| METRORail | $1.25 | • Red Line (25 Stations) – Northline Transit Center to Fannin South • Green Line (9 Stations) – Downtown to Magnolia Park Transit Center • Purple Line (10 Stations) – Downtown to Palm Center Transit Center |
| Ridesharing Services | Depends upon service | Depends upon service |
| SuperShuttle | Ranges from $23–200 depending on destination | • Shared Ride • Non-Stop Ride • Black Car |
| Taxi | $6 | Flat taxi fare for all trips in the downtown area |
If you need a more detailed layout of all of the routes and schedules for these options, make sure to check out Houston’s METRO System.
Free Insurance Comparison
Compare Quotes From Top Companies and Save
Is Parking Easy in Houston?
Another frustrating aspect of driving is trying to find parking in the crowded downtown area. But rest assured, there are options available to you for downtown Houston.
You have a good number of parking garages located conveniently throughout the city, with about 100,000 parking spaces available in total.
Of these parking spaces available, you have 2,200 of them located on the street, 24,000 of them located in surface parking lot spaces, and 75,000 of them located in garage spaces.
Need to park on the street? No worries. Follow these tips to help make sure you stay within the allocated time allowed for parking:
- On-street metered parking is available during the day and on most downtown streets.
- You can park for up to three hours, and after that, you’ll have to move your vehicle.
- Meters are FREE after 6 p.m. Monday through Saturday and are free all day Sunday.
How is the Air Quality in Houston?
As you’ve probably heard all over the news, air quality across the nation has declined due in part to the number of vehicles on the road. Vehicle exhaust helps contribute to the smog problem seen in a lot of the more populated metropolitan areas.
Do you need to worry about the air quality in Houston? Houston has the following air quality according to the EPA:
| Year | Number of Days with AQI | Number of Good Days | Number of Moderate Days | Number of Unhealthy for Sensitive Groups Days | Number of Unhealthy Days | Number of Very Unhealthy Days |
|---|---|---|---|---|---|---|
| 2015 | 365 | 144 | 176 | 30 | 14 | 1 |
| 2016 | 366 | 164 | 179 | 22 | 1 | 0 |
| 2017 | 365 | 184 | 156 | 22 | 3 | 0 |
| 2018 | 365 | 166 | 164 | 26 | 7 | 2 |
As you can see, over the past few years, Houston’s air quality falls under good and moderate air quality values, which is an increase in the number of good and moderate days since 2015.
Where Are the Military/Veteran Bases in Houston Located?
As Texas is one of the largest states in the country, it’s not hard to believe that it has a huge military presence. All of the following major military bases are located in Texas:
- Camp Bullish
- Dyess Air Force Base
- Fort Bliss
- Fort Hood
- Fort Sam Houston
- Goodfellow Air Force Base
- Joint Base San Antonio
- Lackland Air Force Base
- Laughlin Air Force Base
- Naval Air Station Corpus Christi
- Naval Air Station Joint Reserve Base Fort Worth
- Randolph Air Force Base
- Red River Army Depot
- Sheppard Air Force Base
But what about those who have served or are serving at those bases? Let’s take a look at the most common service periods for those who have served in the military:
- Vietnam War – 20,569 veterans
- Gulf War (2000s) – 17,611 veterans
- Gulf War (1990s) – 10,103 veterans
That’s a grand total of 48,283 veterans who have served in the Vietnam and Gulf War, just in the Houston area alone. That’s not including those who have served in other service periods.
With so many veterans in the area, as well as active military personnel, what benefits can this group of individuals receive in terms of car insurance?
Luckily, the following insurance providers offer military insurance discounts to drivers:
- Allstate
- Farmers
- Geico
- Liberty Mutual (must be active duty)
- MetLife
- Safeco (both active and retired)
- USAA (you, your spouse or your parents must be active or retired military to get USAA auto insurance)
So if you’re on active duty or retired, you can expect to see a discount from the above providers for your service.
Free Insurance Comparison
Compare Quotes From Top Companies and Save
What are the Unique Houston Laws?
There are a few unique laws to Houston that we want to go over. Even if you’ve lived in the city your whole life, you may not be aware of all the unique laws until you buy a car or try to open a food truck.
Reading this section, though, will help prepare you for some of the laws you may bump into while living in the city.
The first law we want to touch on is Texas’s hands-free law. Similar laws are in place in most of the U.S., but states have different variations on what mobile use is allowed while driving. Let’s take a look at Texas’s bans.
- Handheld ban – Drivers can’t use handheld devices when driving in an active school zone crossing or public school property.
- Young drivers all cellphone ban – Drivers under age 18 can’t use cellular devices at all.
- Texting ban – Drivers can’t text at all when operating a vehicle.
Texas allows for the primary enforcement of these bans. What does this mean?
Primary enforcement allows law enforcement to directly pull over drivers breaking the hands-free law and issue a ticket. In states with a secondary enforcement law, law enforcement can only pull over drivers in violation if they did something else wrong, such as running a stop sign.
In any state, though, it is important to avoid distracted driving, as this driving mistake is a major cause of accidents.
Another important driving law in Houston is parking laws. It is illegal to parallel park when facing the wrong way, as you will have to pull into oncoming traffic. This endangers not only you but every driver around you. So if an officer sees that your passenger side isn’t curbside, they will issue a parking ticket.
Now that you know what not to do when driving, we want to go over a few laws for specialized vehicles — food trucks and tiny homes.
Like all cities, Houston has special requirements in place for food truck drivers. Any food truck owner in the City of Houston has to be licensed by the city before operation.
Eligibility for a food truck license is determined by passing safety regulations and food preparation licenses. Food inspections must be passed every year for continued operation.
As for tiny home laws, Houston has some laws that work against tiny homes. Zoning regulations and building requirements make it difficult to have a tiny home in the city.
So if you want a tiny home, you will need to seek out some help to make sure your building is legal.
Houston Car Insurance FAQs
Down to the last section of this guide. Here, we’ll go over some of the most common car insurance questions that Houston drivers may have.
Exactly How Populated Is the City of Houston?
Glad you asked.
Houston is ranked as the fourth-most populated city in the United States, according to the National League of Cities.
This ranking is due to the over two million citizens who live in the Houston area, meaning you’ll definitely see more people on the road around you than in other less populated cities.
This population is only going to get larger, as according to the U.S. Census Bureau, between 2010 and 2015 the population of Houston grew by 8.9 percent.
Free Insurance Comparison
Compare Quotes From Top Companies and Save
What Happens If I Get into an Accident in Houston?
In Texas, whoever caused the accident is liable for the other driver’s costs. So if you rear-end another driver, your insurer will have to pay for the other driver’s medical costs and car repairs. If you have poor insurance, some of these costs can fall directly on you.
How Many Airports Are There in Houston?
The city of Houston has two major airports for travelers’ convenience. There is the George H. Bush Intercontinental Airport, which is located in the northern part of the city.
The other major airport is the William P. Hobby International Airport, which is located in the southern part of the city and is the hub for Southwest Airlines.
Should I Worry About my Commute Distance in Houston?
In a word? Yes.
Houston is a very widespread city, so it’s not exactly very walkable. So the farther you are from where you need to commute, the more likely you’ll have to worry about traffic congestion.
As we mentioned in an earlier section, Houston definitely isn’t exactly a haven for those who experience road rage. So making sure you are able to find a location closer to your commute in Houston definitely wouldn’t hurt.
Can I keep my Current Driver’s License If I’m Moving to Houston?
If you’re moving from another city in Texas, yes, you can keep your driver’s license. You just need to update your current address to reflect your move to the city of Houston.
If you’re coming in from another state, however, there’s a little more paperwork involved, unfortunately.
You’ll need to visit the local Department of Motor Vehicles office to transfer your out-of-state license for a new Texas license. Make sure you have the following documentation with you when getting your new license:
- Your out-of-state driver’s license
- Proper identification (Example: your birth certificate)
- Social Security number
- Proof of residency in Houston (such as a lease agreement for an apartment, or paperwork for a house payment)
- Pass a vision test
- Have payment for the new license
Make sure to check out the Texas Department of Public Safety if you need any help trying to get a new license to transfer out of state.
We hope that this comprehensive guide for Houston, Texas, drivers will help make your life a little easier. Stay safe driving out there in the Lone Star State.
Do you want to start comparing car insurance rates today? Use our FREE online tool now, all you need is your ZIP code to get started.