Best Car Insurance in Washington, D.C. for 2026 [Compare the Top 10 Companies]
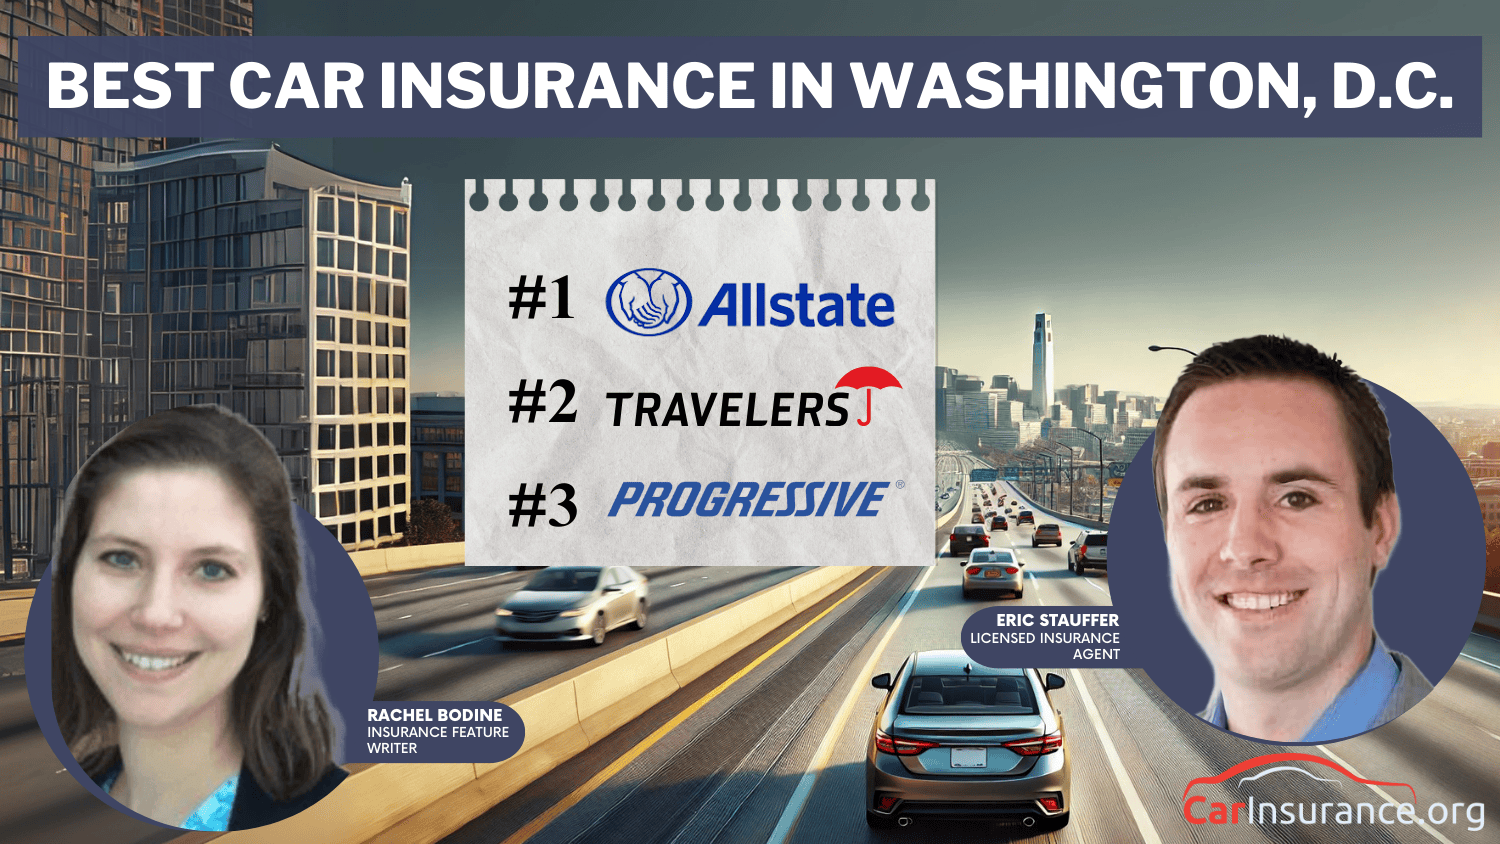
Allstate, Travelers, and Progressive offer the best car insurance in Washington, D.C., with monthly rates as low as $20. With 318,000 registered vehicles and 15.6% of motorists uninsured, these car insurance companies in Washington, D.C ensure essential protection for all drivers in the city.
Quote’s drivers have found rates as low as $42/month in the last few days!
Updated Aug 2025
Learn more about Progressive Insurance, what products they offer, what their consumers think about them and ho... more
Learn more about Progressive Insurance, what products they offer, what their consumers think about them and how they compare against other carriers. less
Allstate's best-in-class products and services help provide innovative protection and retirement solutions to ... more
Allstate's best-in-class products and services help provide innovative protection and retirement solutions to millions of households nationwide.\n\nOur evolving business strategies and solutions continue to reinvent the industry standards, helping our customers better protect what they have today and prepare for a brig less
Geico, short for Government Employees Insurance Company, is an American auto insurance company. It was founded... more
Geico, short for Government Employees Insurance Company, is an American auto insurance company. It was founded in 1936 and is currently headquartered in Chevy Chase, Maryland. Geico is known for its catchy advertising campaigns and its focus on providing affordable car insurance to a wide range of customers. The compan less
Rachel Bodine graduated from college with a BA in English. She has since worked as a Feature Writer in the insurance industry and gained a deep knowledge of state and countrywide insurance laws and rates. Her research and writing focus on helping readers understand their insurance coverage and how to find savings. Her expert advice on insurance has been featured on sites like PhotoEnforced, All...
Eric Stauffer is an insurance agent and banker-turned-consumer advocate. His priority is educating individuals and families about the different types of insurance coverage. He is passionate about helping consumers find the best coverage for their budgets and personal needs.
Eric is the CEO of C Street Media, a full-service marketing firm and the co-founder of ProperCents.com, a financial educat...
Allstate is the top pick for the best car insurance in Washington, D.C., offering competitive rates starting as low as $50 per month. Together with Travelers and Progressive, they offer cheap premiums, extensive coverage, and excellent customer satisfaction.
These providers accommodate the needs of various drivers and thus are suitable for D.C. residents. They can also help you to lower your car insurance costs. By getting quotes from these best providers and comparing them, you can obtain the best prices and coverage for your situation.
Our Top 10 Company Picks: Best Car Insurance in Washington, D.C.
Comprehensive Coverage Options: Allstate offers car insurance coverage for Washington, D.C. drivers, including liability, and collision.
Drivewise Discount Program: Safe driving rewards help Washington, D.C. drivers save with Allstate’s Drivewise program.
Unique Perks: Learn more about its unique perks in our Allstate insurance review, which covers accident forgiveness and new car replacement for car insurance in Washington, D.C.
Cons
Relatively High Rates: Car insurance premiums may be higher for younger Washington, D.C. drivers.
Limited Local Availability: Some areas in Washington, D.C., may have limited car insurance services.
Excellent Discount Options: Washington, D.C. drivers can save through bundling and homeownership discounts from Travelers, helping to reduce overall insurance costs.
High A.M. Best Rating: Travelers offers financial reliability to Washington, D.C. residents. For further details, read our Travelers insurance review.
Accident Forgiveness: Washington, D.C. drivers avoid premium increases after their first at-fault accident.
Cons
Customer Service Reports: Some Washington, D.C. drivers report poor customer service experiences.
Higher Premiums for Younger Drivers: Younger drivers in Washington, D.C., face higher rates than other car insurance providers.
#3 – Progressive: Best for Budgeting Tools
Pros
Budgeting Tools: Progressive helps Washington, D.C. drivers manage insurance costs with tools like payment calculators and flexible plans.
Snapshot Discount: Safe driving behavior rewards Washington, D.C. drivers with discounts through Progressive’s Snapshot program.
Flexible Coverage Options: Progressive offers various coverage options to meet the needs and budgets of Washington, D.C. drivers.
Cons
Limited Local Branches: Progressive may not offer in-person service in certain Washington, D.C. areas. For further details, read our Progressive insurance review.
Complex Online Interface: Some Washington, D.C. drivers find Progressive’s website hard to navigate.
#4 – Geico: Best for Competitive Rates
Pros
Exceptional Customer Service: Geico offers fast, reliable service for timely assistance in Washington, D.C.
Variety of Discounts: Washington, D.C. drivers can save with discounts like bundling and military insurance.
Affordable Prices: Geico provides budget-friendly car insurance for price-sensitive Washington, D.C. drivers.
Cons
Limited Coverage Options: Geico may offer fewer coverage options for Washington, D.C. residents with specialized insurance needs.
Additional Fees: Some Washington, D.C. drivers may face additional fees at sign-up, raising their overall policy cost. Find out more by reading our Geico car insurance review.
Comprehensive Coverage: State Farm offers different coverage options that are custom to Washington, D.C. residents.
Safe Driver Discounts: Washington, D.C.’s safe driver incentives reward responsible driving and can save drivers money.
Excellent Reputation: Check out our State Farm car insurance review, where you’ll learn why many Washington, D.C. drivers trust it for its reliability and customer service.
Cons
Lower A.M. Best Rating: State Farm’s B rating from A.M. Best may cause some Washington, D.C. drivers to question its financial stability.
Premiums May Be Higher for Some: Washington, D.C. drivers might find State Farm’s rates higher than other providers in the area.
#6 – USAA: Best for Military Savings
Pros
Military-Specific Discounts: USAA provides exclusive insurance savings for military families in Washington, D.C.
High A.M. Best Rating: USAA’s financial stability is a strong point for drivers in Washington, D.C.
Excellent Customer Service: It is known for delivering exceptional customer service to Washington, D.C., Military members.
Cons
Membership Restrictions: USAA insurance is only available to military families in Washington, D.C. Take a look at our USAA car insurance review for more insights.
Less Flexible Coverage: Washington, D.C. drivers may find fewer coverage options with USAA compared to other car insurance providers.
#7 – Farmers: Best for Accident Forgiveness
Pros
Personalized Service: Farmers provides tailored car insurance plans for drivers in Washington, D.C.
Accident Forgiveness: Washington, D.C. drivers can avoid insurance premium hikes after accidents with Farmers.
Variety of Discounts: It provides a wide range of discounts, such as bundling and good student incentives, to Washington, D.C. drivers.
Cons
Limited Digital Tools: For Washington, D.C. drivers, Farmers’ online tools may not be as advanced or user-friendly. Read more in this Farmers car insurance review.
Higher Premiums for New Drivers: New Washington, D.C. drivers may face higher premiums, especially without a driving history.
Unique Coverage Options: Liberty Mutual offers accident forgiveness and new car replacement coverage for Washington, D.C. drivers.
Bundling Discounts: Read our Liberty Mutual car insurance review to learn how to save on insurance by bundling home and auto coverage in Washington, D.C.
Competitive A.M. Best Rating: Liberty Mutual has a solid A rating for residents of Washington, D.C.
Cons
High Premiums: Liberty Mutual’s car insurance premiums may be pricier than other providers in Washington, D.C.
Limited Discount Availability: Certain car insurance discounts may not be available to Washington, D.C. drivers.
#9 – Nationwide: Best for Vanishing Deductible
Pros
Vanishing Deductible: Washington, D.C. drivers can reduce their car insurance deductible over time with Nationwide’s program.
Wide Range of Discounts: It offers bundling, safe driver, and accident-free discounts for Washington, D.C. drivers.
Reliable Customer Support: Nationwide provides dependable service for Washington, D.C. residents. For additional insights, read our Nationwide car insurance review.
Cons
Limited Coverage Flexibility: Nationwide’s coverage options may be less flexible for Washington, D.C. drivers than other car insurance providers.
Higher Initial Premiums: New Washington, D.C. customers might pay higher insurance premiums with Nationwide.
#10 – American Family: Best for Loyalty Discounts
Pros
Loyalty Discounts: American Family rewards long-term customers in Washington, D.C., with loyalty discounts on their car insurance.
Comprehensive Coverage: Read our American Family insurance review to learn about the variety of insurance coverage options offered to Washington, D.C. drivers.
Excellent Customer Service: It is known for providing outstanding car insurance service to residents in Washington, D.C.
Cons
Rates May Be Higher for Young Drivers: In Washington, D.C., younger drivers may face higher car insurance premiums.
Limited Discounts: Some Washington, D.C. drivers may not qualify for all discounts offered by American Family.
Car insurance is essential for all drivers in Washington, D.C. With the dense population and busy roadways, ensuring proper coverage protects you and others in case of an accident or unforeseen event.
Best Car Insurance in Washington, D.C. for 2026 [Compare the Top 10 Companies] Statistic Summary
Road Miles1.507B
Registered Vehicles318,515
State Population702,455
Most Popular VehicleHonda Civic
Percentage of Uninsured Motorists15.6%
Driving DeathsSpeeding: 17Drunk Driving: 16
Average Premiums Annually
Liability: $629Collision: $469Comprehensive: $233
Cheapest Provider: USAA & State Farm
According to the data above, Washington, D.C., has over 318,000 registered vehicles and a population of more than 700,000. However, with 15.6% of motorists uninsured, the risk of financial loss for insured drivers is higher.
Car insurance premiums increase due to the 15.6% uninsured driver rate, shifting the financial burden to policyholders.
Brad Larson
Licensed Insurance Agent
With so many uninsured drivers on the road, choosing the right insurance is vital for your protection. Let’s take a closer look at various providers’ monthly rates in Washington, D.C.
Washington, D.C. Car Insurance Monthly Rates by Provider & Coverage Level
Car insurance rates in Washington, D.C., vary depending on the provider and coverage level. USAA offers minimum coverage for as low as $20 per month, while full coverage ranges from $46 to $114 monthly.
With the number of uninsured drivers and the prices in Washington, D.C., it is important to get the appropriate type of car insurance coverage to provide economic protection and help reduce individual liability in crashes.
Washington, D.C. Car Insurance Discounts
Car insurance providers in Washington, D.C., offer various discounts to help drivers save money on premiums. These discounts are often based on driving habits, vehicle type, and policy bundling.
Car Insurance Discounts From the Top Providers in Washington, D.C.
Insurance Company
Available Discounts
Drivewise, Bundling, New Car, Good Student, Early Signing, and Safe Driving Discounts.
Bundling, Good Student, Early Signing, Loyalty, Safe Driver, and Multi-Vehicle Discounts.
Bundling, Claims-Free, Homeownership, Good Student, New Car Replacement, and Accident Forgiveness Discounts.
Good Driver, Bundling, Military, Federal Employee, Student, Safe Driver, and Membership/Affinity Discounts.
Bundling, Auto Pay, New Car, Good Student, Early Shopper, and Safe Driving Discounts.
Vanishing Deductible, Bundling, Safe Driver, Accident-Free, and Good Student Discounts.
Snapshot, Bundling, Continuous Insurance, Homeownership, and Online Quote Discounts.
Safe Driver, Bundling, Good Student, Accident-Free, and Defensive Driving Discounts.
Bundling, Safe Driver, Early Quote, Homeownership, and Continuous Insurance Discounts.
Military, Bundling, Good Student, Safe Driver, and Annual Payment Discounts.
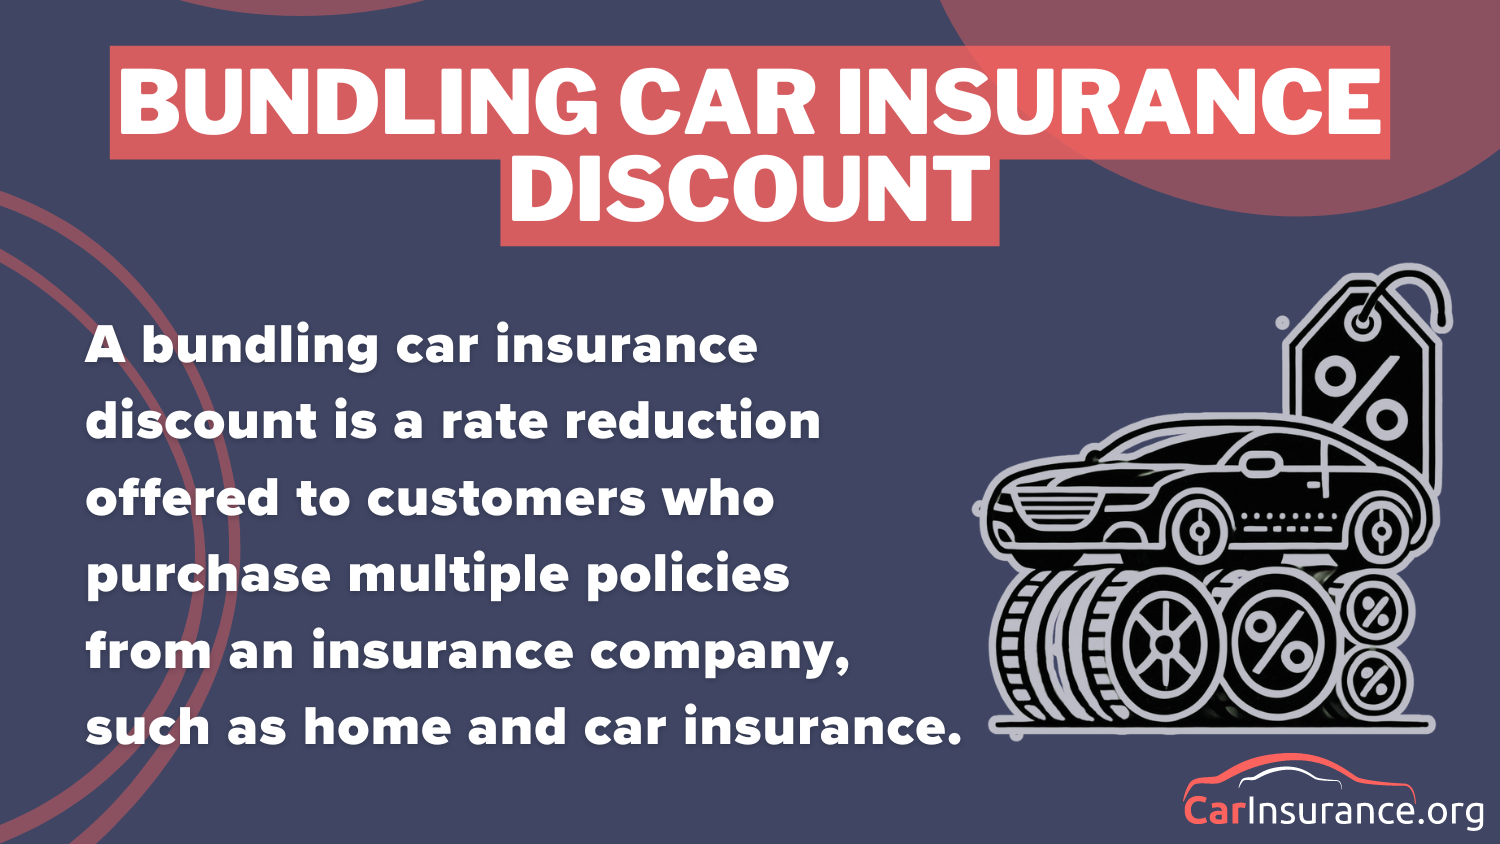
Based on the table, Allstate offers discounts, such as Drivewise and bundling, to reward safe drivers and those with multiple policies. American Family offers savings for good students and long-term customers, while Farmers and Geico provide discounts for safe driving, homeownership, and military affiliation.
One key way to save is through Allstate’s bundling car insurance discount, which allows policyholders to combine multiple insurance policies, such as auto and home, for more significant savings. Drivers can better manage their insurance costs by taking advantage of available discounts and being mindful of behaviors that may increase premiums.
Washington D.C. Car Insurance Coverage and Rates
There’s a lot to know about car insurance in D.C., especially if you’re trying to get the best rates for coverage. We’ll show you how your driving history, age, gender, and even credit score make a difference in your rates.
D.C.’s Minimum Requirements
To register and drive a car in D.C., you are required to have liability insurance. You’ll often see the minimum requirement written out as 25/50/10. In other words:
$25,000 bodily injury liability per person
$50,000 bodily injury liability per accident (multiple persons)
$10,000 property damage liability
Let me take a moment right here to point out that these minimums are ridiculously low (especially for property damage) and you’d be wise to consider more adequate coverage. Something around 100/300/70.
This scenario should help you understand why $10,000 property damage coverage is too little. If you cause an accident and you end up causing a brand new full-size SUV to be a total loss, you’re looking at $60,000 of property damage that you’re liable for.
With $10,000 coverage, you’re left with $50,000 of financial responsibility that you owe the other party. And you’ll have to come up with that on your own.
Protect your financial situation and purchase higher liability limits.
If you are in an accident or if you are pulled over, you’re required to show proof of insurance to the law enforcement officer when requested. You may carry electronic proof of insurance or a paper version.
And this proof must be
“a document issued by an insurance company that lists the name of the insurance company, the policy number, the name or names of the insured, and the period of coverage for the insurance.”
So, ask your insurance company to send you a PDF that proves your coverage. Then you’ll have what you need to show proof of insurance.
Forms of Financial Responsibility
While some states allow you to purchase a bond or certificate of self-insurance, in Washington D.C., you must have insurance.
Premiums As a Percentage of Income
Average auto insurance rates vary greatly depending on where you live. It helps to give those rates some perspective by comparing what the average income is with what the average car insurance rates are.
If rates where you live are high, but people tend to make a lot of money, those high rates are a little easier to handle compared to people living where insurance is expensive and the income average is low.
Here’s how premiums as a percentage of income look for Washington D.C.
As you can see, the percentage rose in 2013 but settled back down in 2014. When you compare the percentage to the surrounding states, Virginia’s percentage is lower than D.C.’s while Maryland’s is higher, but they’re all within half a percent of each other.
So, while D.C. compares fairly equally to car insurance costs in Virginia and Maryland, how does it stand up to the U.S. average? It’s a little bit lower. The U.S. premiums as a percentage of income was 2.4 percent in 2014 compared to Washington D.C. at 2.2 percent.
Average Monthly Car Insurance Rates in Washington D.C. (Liability, Collision, Comprehensive)
Car insurance in D.C. costs more than the countrywide average, but the good news is that in five years annual rates in D.C. only increased $54 for full coverage while the U.S. rates increased $101.
Here’s a comparison of rates for different types of coverage in Washington, D.C., compared to the countrywide average.
These averages were published by the National Association of Insurance Commissioners (NAIC) and the liability coverage rates are based on state-required minimum coverage insurance.
Additional Liability Coverage
Insurance companies stay in business by offering affordable premiums to attract customers but high enough that they (the insurance company) come out ahead in the end.
If an insurance company receives $100 in premiums and pays out $67 in claims, we would say their loss ratio is 67 percent. That means they’re left with $33 for their overhead. If that sounds fair to you, you’re right on. That’s a nice healthy ratio.
As you can imagine, a company that earns $100 in premiums and pays out $115 in claims over and over again for several years in a row isn’t going to stay in business very long. Their loss ratio would be over 100 and that would be bad.
Personal injury protection (PIP) and Medical Payments (MedPay) are two similar coverage types that pay for your and your passengers’ injury costs following an accident.
As you can see in the table below, the PIP coverage in D.C. had a rough year in 2013 but has bounced back nicely.
MedPay has had a loss ratio that has been all over the map in recent years while uninsured and underinsured motorist coverage has held fairly steady as far as their losses to earnings.
Just how many people are driving around D.C. uninsured? A whopping 15.6 percent. That ranks D.C. as number 10 nationally for having the most uninsured drivers.
That knowledge should make you check your policy right now and make sure you have uninsured/underinsured motorist coverage.
Think about it, if an uninsured motorist causes a collision with you and you only have liability coverage, you’re out of luck. You just lost the use of your vehicle for something that wasn’t your fault and you most likely aren’t going to get any compensation.
Add-ons, Endorsements, and Riders
The basic insurance coverages are liability, collision, and comprehensive, but there are more options available for you to consider.
Average Monthly Car Insurance Rates by Age & Gender in Washington D.C.
There’s a hot topic in car insurance and it concerns the difference in rates between males and females. Some states have outlawed using gender in car insurance rate formulation.
Car insurance companies claim that different demographic groups pose more risk to them and riskier groups should pay higher rates. That sounds fair, but it’s interesting that who pays more in each age group – men or women – varies between states and companies.
So, it can’t be as cut and dry as the insurance companies make it out to be. The one place where we can all agree that the stats back up the rates is with teen males. They consistently have demonstrated a higher rate of accidents and dangerous driving behavior.
In D.C., the teenage age group is the only one where males pay more than females across the board. For the other age groups, males tend to pay higher rates than females although there are exceptions depending on the company.
You may be wondering where we got our rate data. It’s based on coverage that has actually been purchased. It includes everything from rates for high-risk drivers to rates for minimum coverage insurance. If you have a good driving record, it’s likely your rates will be quite a bit lower.
On the other hand, if you’re a high-risk driver, your rates will likely be a lot higher.
These rates give you a baseline idea of what to expect but your rates could vary greatly. That’s why it’s so important that you do a rate comparison search. That will help you find the best rates for your situation.
Cheapest Rates by Zip Code
https://www.youtube.com/watch?v=goE-0PfI4pw
Normally, rates within a state or city vary greatly, sometimes up to $400 annually within the same city. This is not the case with D.C. Their rates don’t change at all between ZIP codes with one exception.
In zip code 20001, Progressive charges $343 less than in every other ZIP code. Other than that, rates are equal across ZIP /codes.
You might be feeling like you just got a whole lot of car insurance information, but it’s just way out there, out of practical reach. We’ll try to bring it home to you so you have a really good idea about what company is best for your situation.
Not only will we look at car insurance rates, but we’ll examine some other important topics like companies’ financial ratings and customer service reviews.
The Largest Companies’ Financial Ratings
AM Best is an independent company that rates the financial standings of insurance companies. As you can see, the 10 largest insurers in D.C. received good grades from AM Best.
It’s not surprising that the larger companies perform so well. They earned their market share by providing solid policies for many years.
Customer satisfaction reports should matter to you because if a company tends to have happy customers, it’s because they treat them right, so if you were a customer, they’re more likely to treat you right.
Here are the results from the J.D. Power Auto Insurance Satisfaction Survey. The Power Circles listed below are the equivalent of stars. So a Five Power Circle Rating would be like a Five-Star Rating
USAA – 898 – 5 Power Circles
NJM Insurance Co. – 861 – 5 Power Circles
Erie Insurance – 852 – 5 Power Circles
Geico – 845 – 4 Power Circles
The Hartford – 842 – 4 Power Circles
Mid-Atlantic Average – 838 – 3 Power Circles
State Farm – 834 – 3 Power Circles
Progressive – 828 – 2 Power Circles
Farmers – 826 – 2 Power Circles
Plymouth Rock Assurance – 826 – 2 Power Circles
Nationwide – 822 – 2 Power Circles
Travelers – 821 – 2 Power Circles
CSAA Insurance Group – 817 – 2 Power Circles
Liberty Mutual – 817 – 2 Power Circles
Allstate – 816 – 2 Power Circles
Companies With the Most Complaints in D.C.
Bigger companies have more customers and they’ll get more complaints. What really matters is the complaint ratio. If a company sells 100,000 policies and receives 10 complaints, they’re doing a whole lot better than a company that sells 10 policies and gets five complaints.
The complaint information in the table above is from national data. It’s not specific to the D.C. region but it gives a good overall picture of each company’s complaint data.
The Cheapest Companies in D.C.
We partnered with Quadrant to bring you this data that shows what actual D.C. customers are paying for car insurance.
As you can see, half of the companies we studied didn’t change their rates between a 10- and 25-mile commute. It would make sense that the more miles you drive, the higher your risk of being in an accident and the more expensive your rates, but not every company feels that way.
When you have more coverage, the insurance company takes on a great risk. Insurance is all about risk, so more risk means more cost to the consumer.
Surprisingly, Nationwide’s rates drop slightly when you purchase high-level coverage instead of medium.
Credit History Rates by Company
Geico has great rates for those with good credit scores and even for those with fair credit scores, but their rates jump dramatically for customers with poor credit. Keep that in mind depending on where your credit rating is.
Credit score has a huge impact on car insurance rates in Washington D.C. Like rates based on gender, rates based on credit is a hotly debated topic. Several states have banned credit scores in the formulation of car insurance rates.
Insurance companies argue that those with lower credit scores are more risk to them.
Your credit rating for insurance is not the same as your credit score. They’re both based on your credit report, though. The insurance companies pull the information they think is the most relevant so although it’s similar, it’s not the same as your credit score.
According to Experian’s State of Credit report, the average credit score in D.C. is 670 which is just below the national average of 675 and they come in seventh place for the state with the most credit card debt.
It seems a little crazy that a poor credit score would have a greater effect on your rates than having a DUI on your record, but that’s what the data shows us is the case for most car insurance companies in D.C.
Progressive and State Farm both charge policyholders less for a DUI on record than they do for an accident on record. You would think that DUI would have the greatest impact on rates because of all the statistics about repeat offenders.
This table shows you just how much your rate is likely to increase after a violation when compared to a clean record.
Geico has a huge slice of the pie when it comes to market share in D.C. In fact, they own over one-third of the car insurance market. Likely, that’s because it started as an insurance company for government employees, and, well, D.C. has a lot of those.
The Number of Insurers in Washington D.C.
There are 790 out-of-state property and casualty insurance companies licensed in D.C. and six in-state companies licensed.
With a little math, you’ll see that there are 796 companies licensed to sell policies in D.C. That’s a lot of companies to choose from.
With all the laws that vary in each state, it can be hard to grasp what’s important to know. We’ll show you the highlights so you can be confident with all things driving-related.
We’ll start by explaining what you need to know about insurance in D.C., and then we’ll cover licensing laws, so if you’re new to the area, you’ll definitely want to read that over a time or two.
Finally, we’ll go over the rules of the road. Even if you’ve been driving a long time, you’ll probably learn something you didn’t know.
Car Insurance Laws
With all the laws that vary in each state, it can be hard to grasp what’s important to know. We’ll show you the highlights so you can be confident with all things driving-related.
We’ll start by explaining what you need to know about insurance in D.C., and then we’ll cover licensing laws, so if you’re new to the area, you’ll definitely want to read that over a time or two.
Finally, we’ll go over the rules of the road. Even if you’ve been driving a long time, you’ll probably learn something you didn’t know.
Car insurance is required in Washington D.C., and that’s the most important law you need to know. You’d benefit from knowing a little more than that, though, so we’ll cover that next.
Form filings must be approved prior to use, but rate filings don’t need approval. They must be filed but can be used without approval.
There are no specific laws concerning windshield coverage in D.C. How an insurance company handles glass coverage is up to them, so if you’re wondering, ask your insurer.
If your driving record is bad enough, insurance companies aren’t going to want to take on your risk. The problem is, no matter how risky you are, you still have to have insurance to drive.
To make sure that everyone can get insurance, insurance providers share risk in the D.C. Automobile Insurance Plan (DCAIP). So, if you can’t find insurance on the competitive market, you will be able to find some with DCAIP.
Some high-risk drivers, especially those with a DUI on their record, will be required to file an SR22. An SR22 is not insurance, it’s just a form that your insurance company files with the state that says you will have insurance for the required period.
In D.C., the SR-22 filing goes hand-in-hand with an ignition interlock device requirement if you want to reinstate your license following a DUI conviction.
There are just a few states that offer a low-income, low-cost insurance program. D.C. is not one of them. Your best strategies to obtain the lowest cost insurance possible are as follows:
Compare rates to find lower-cost insurance
Cut down on coverage if you have to
Increase your deductible
Ask your insurer about discounts or other ways to save
How to Report Automobile Insurance Fraud in Washington D.C.
If you’re a law-abiding citizen, you may be wondering why fraud even matters to you. Well, it’s estimated that fraud makes up 10 percent of insurance companies’ losses.
If fraud wasn’t taking place, that savings could be passed on to the customer.
There are two types of fraud. Hard fraud is the most obvious. Staged accidents, false claims, and lying about injuries are examples of hard fraud.
Soft fraud seems like a white lie, but it costs the insurance companies considerable. Lying about your address, or people in your household or any other personal information is considered soft fraud.
It’s illegal, and if your insurance company finds out, you could be denied coverage.
Here are the penalties for committing insurance fraud in D.C.
Crime
Penalty
Insurance Fraud First Degree
Fine up to $50,000, 15 years imprisonment, or both
Insurance Fraud Second Degree
Fine up to $10,000, 5 years imprisonment, or both
Insurance Fraud Second Degree Second Offense
Fine up to $20,000, 10 years imprisonment, or both
Here’s what Washington D.C. has established to fight fraud:
Insurance fraud is classified as a crime
Immunity statutes are in place
A fraud bureau has been established
A mandatory insurer fraud plan is required
If you suspect insurance fraud, you can file a complaint at disb.dc.gov, by phone at (202) 727-8000, or in person at 1050 First St., NE, Suite 801, Washington, D.C.
Statute of Limitations in Washington D.C.
The statute of limitations in Washington, D.C., is three years for both property damage and personal injury.
The statute of limitations is hard and fast. If you want to file a claim or lawsuit following a car accident or damage, you have three years. If you don’t file within three years, you have no case.
Auto insurance companies are required to notify the Department of Motor Vehicles (DMV) any time someone cancels coverage. The DMV will then send the individual a proof of insurance notification.
If you don’t maintain continuous insurance, your registration will be suspended, and you will be subject to fines.
Accident reports are to be filed with the Metropolitan Police Department and not with the D.C. DMV.
Washington D.C.’s Vehicle Licensing Laws
Every state has a slightly different system for vehicle licensing. Here’s how D.C. handles it.
REAL ID
Washington D.C. has been issuing REAL IDs since May 1, 2014.
If you’re unsure if you have a REAL ID, you need to make sure you know because starting in October of 2020, you have to have one (or a passport) to fly domestically in the U.S.
How can you tell? If your driver’s license is REAL ID compliant, you will see a star in the upper right-hand corner of your license.
If you still need to get a REAL ID, you’ll have to do it in person, and you should take care of it soon so you’re not stuck needing to fly but not being able to.
These are the documents needed to get a REAL ID for the first time:
Proof of ID
Proof of Social Security Number
Two proofs of residency
A REAL ID license is valid for 8 years.
Penalties for Driving Without Insurance
If you’re caught driving without insurance, you’re going to get penalized. Here’s what you’re looking at.
Offense
Penalty
Driving Without Insurance First Offense
$500 civil fine, license suspension up to 30 days, or both
Driving Without Insurance Second and Subsequent Offenses
An increase of 50% over the civil fine for the first offense for each subsequent offense, license suspension up to 60 days, or both
Acceptable proof of insurance includes both paper and electronic proof of coverage. Your insurance card is valid, as is a copy of your coverage through your insurance provider’s app.
Insurance providers in D.C. have to notify the DMV if you cancel coverage.
Like the general population, older drivers have to renew their licenses every eight years, and they have to have proof of adequate vision at every renewal.
The difference between older drivers and the general population as far as license renewal requirements is that the general population may renew by mail or online every other renewal, but drivers over 70 years old must renew in person every time.
New Residents Registering Their Car in Washington D.C.
To register a vehicle in D.C., you must first have a D.C. license or ID. The D.C. government website recommends not waiting until your out-of-state license expires but instead starting the process of getting a D.C. license early.
To get your vehicle registered, it must be inspected. You can have your vehicle inspected with out-of-state registration. The fee for the inspection is collected when you register.
You must get your license renewed every eight years. You can do this online, by mail, or in person. You must renew in person at every other renewal at least.
Rules of the Road
In our final section regarding the laws in D.C., we’ll examine the laws for when you’re actually driving. Disobeying these regulations could result in a ticket, and you definitely want to avoid that.
You’ll be able to follow these rules best if you know them, obviously.
Fault vs. No-Fault
Most states have tort laws where the at-fault party in a crash is responsible for all damages. Some states have no-fault laws where each part has to pay for their own injury costs regardless of who is at fault.
Washington, D.C., does its own thing with a contributory fault system, which is closer to no fault than it is to torte.
If one party is 100 percent at fault, they are responsible for damages and injuries, but if any bit of fault is attributed to the other driver, the majority-fault party is not responsible for injury costs.
Seat Belt and Car Seat Laws
Seat belt laws are primary in Washington D.C. That means that you can be pulled over not wearing a seatbelt. The law applies to anyone over 16 years old and the penalty for the first offense is $50.
Children under 16 years old are under child safety seat laws.
Requirement
Age
Rear Facing Seat
younger than 2 years must be in a rear-facing child restraint unless the child weighs 40 or more pounds or is 40 or more inches tall
Child Safety Seat (can be forward facing)
3 years and younger in a child restraint
Booster Seat (can be in a safety seat)
4 years through 7 years must be in a child restraint or booster seat
Drivers must move over to emergency vehicles with sirens or lights on if it’s safe to do so. If it’s not safe to move to the adjacent lane, drivers must use caution and maintain a safe speed.
Washington D.C. doesn’t have laws requiring slower traffic to keep right. Maybe that’s part of their out-of-control traffic problem.
Speed Limits
The speed limits must be followed or you could get a speeding ticket which not only costs money in itself but could also make your car insurance rates rise.
D.C.’s Department of Public Works set up a program called Via for government employees. The program’s shared-ride program works like carpooling, and they also have standard rideshare and taxi programs for an increased cost.
Via sends the invoices to the Department of Public Works who sends the bill to the appropriate government agencies of the employees who used the program.
If you’re a government employee, this program sounds like a win-win. It reduces the volume of traffic on the road and it doesn’t cost you anything.
Of course, the usual rideshare options are also available in Washington, D.C., and more and more auto insurance companies are offering supplemental insurance plans for rideshare drivers.
Automation on the Road
Washington, D.C., is pretty progressive when it comes to automated vehicles. They have already been deployed on the roadways although a licensed operator must be present in the vehicle.
There are no specific liability insurance laws for autonomous vehicles in D.C.
Unique Laws in D.C.
Washington D.C. is cracking down on speeding. They aim to eliminate traffic deaths by 2024. Their strategy? Extreme penalties.
Driving 25 mph or more over the speed limit – $400 fine on highways, $500 fine on city streets
Driving 30 mph or more over the speed limit – a criminal offense
In addition to heightened penalties, there are some other new laws to pay attention to:
School zone speed limits are between the hours of 7:00 am and 11:00 pm
Delivery truck and Uber drivers face $150 penalties for blocking bike lanes
Riding a bike with headphones in both ears could cost you a $50 fine
Safety Laws in Washington D.C.
These laws deal with impaired and distracted driving. Both of these are dangerous activities and should be eliminated.
DUI Laws in Washington D.C.
Driving under the Influence (DUI) is a misdemeanor offense in Washington D.C. The lookback period where previous offenses are considered in the penalties for a subsequent offense is 15 years.
Penalty
First Offense
Second Offense
Third Offense
License Suspension
6 months
1 year
2 years
Imprisonment
No minimum, but up to 90 days.
BAC 0.20-0.25: mandatory 5 days. BAC 0.25+: mandatory 10 days
up to 1 year with 5 mandatory days or 30 days community service. BAC 0.20-0.25: mandatory 10 days. BAC 0.25+: mandatory 20 days
Up to 1 year with 5 mandatory days or 30 days community service. BAC 0.20-0.25: mandatory 15 days. BAC 0.25+: mandatory 25 days
Fine
Up to $300
$1000-$5000
$2,000-$10,000
Other
Possible alcohol diversion program requirement if BAC>0.16
Ignition Interlock Device
All those convicted of a DUI are required to install an ignition interlock device (IID).
Marijuana-Impaired Driving Laws
There are no marijuana-specific driving laws in D.C. If you’re caught driving impaired because of marijuana use, you’re subject to the same penalties as a DUI.
DUI laws in D.C. cover both alcohol and drug-impaired driving.
Distracted Driving Laws
Washington D.C. has a handheld ban for all drivers. That means you cannot use your phone or another electronic device for making or receiving calls unless it’s on handsfree mode.
Texting is prohibited for all drivers. Drivers with a learner’s permit may not use a cell phone at all, even in hands-free mode.
These laws are primary, and you can be pulled over for a violation.
Everything we’ve talked about, insurance, laws, vehicles, etc. all centers around driving. If we didn’t need to drive, we wouldn’t need any of those other things.
Driving is pretty important but you might feel weighed down by the vast amount of information available. What do you need to know and what can you skip over? Don’t worry. We’ll help you!
We’ll look at some sober statistics because sometimes just knowing how dangerous driving can be will help us to be more careful. We’ll also go over commuter options, including what is available as alternatives to driving.
And finally, we’ll deal with the very frustrating subject of traffic. By the time you’re finished, you’ll feel pretty well-educated about driving in D.C.
Frequency of Vehicle Theft in Washington D.C.
Some vehicles are more appealing to car thieves than others for various reasons. In D.C., if you have a Dodge Caravan, you’ll want to be extra cautious about keeping it locked and not storing valuables in it because it’s the most stolen vehicle.
According to the FBI, 2,545 were stolen in the District of Columbia in 2017. Here’s the breakdown of the top ten most popular stolen vehicles and how many were stolen.
Weather, congestion, and other factors all play a role in the safety of a roadway. Here are some statistics about road-related deaths.
One of the most dangerous routes in the area is Route 1. As the highway cuts across Maryland on its way to and from D.C. the fatality rate is 0.7.
Fatal Crashes by Weather Condition and Light Condition
It’s pretty clear by the statistics in the table below that the most dangerous time to drive is when it’s dark but lighted. The majority of fatal crashes happened in those conditions.
When compared to the 50 states in the U.S., Washington D.C. is at the bottom not only for drunk driving as a whole but also for teen drinking and driving.
They have the fewest – zero, in fact – teen drinking and driving arrests in the nation, and that puts them in the best position.
Even though complete data is only available for about 7 percent of crashes, we can get a little bit of an idea about how long it takes on average from the time you call emergency services until you arrive at the hospital, if necessary.
Average Time of Crash to EMS Notification
Percent Unknown of Time of Crash to EMS
Notification
Average Time EMS Notification to
EMS Arrival
Percent Unknown EMS Notification to
EMS Arrival
Average Time EMS Arrival at Scene
to Hospital Arrival
Percent Unknown Time EMS Arrival at Scene
to Hospital Arrival
A lot of U.S. cities don’t have many options for how to get around. You either drive yourself or you have someone drive you. D.C. has another option, and that is mass transit.
Let’s see how Washington D.C. compares to the U.S. as a whole as far as transportation statistics go.
Car Ownership in Washington D.C
In the U.S. as a whole, more households have two vehicles than any number of vehicles, but in D.C., far more households have only one car. It’s not as difficult to get by with one car when public transportation is an option, which is in D.C.
Nationally, about 20 percent of households have one vehicle while just over 40 percent of households have two vehicles. Washington D.C.’s statistics are close to the reverse of that. Over 40 percent of households have one vehicle while just over 20 percent have two.
Another area where they’re way off the national average is in households with no vehicles. More households in D.C. have no vehicles (about 25 percent of households) than have two cars, while nationally, less than five percent of households have no vehicles.
Commute Time in Washington D.C
When you average the commute times, D.C.’s commute of 28.6 minutes is over three minutes longer than the U.S. average of 25.5 minutes. Nearly 20 percent of D.C.’s residents have a commute time between 30 and 34 minutes.
Commuter Transportation in Washington D.C
By far, the two most popular forms of commuter transportation over the past five years have been driving alone and public transportation. The next most common mode of transportation is walking to work.
Washington, D.C., has a great public transit system going for it. If you need to, you can get anywhere you need to go without ever sitting in a car. In fact, almost as many people take public transportation to work as drive alone to work.
The traffic in D.C. is some of the worst in the U.S.
Now that you know everything you need to about driving and insurance in Washington D.C., you’ll be able to make an educated choice about how to choose an insurance provider.
Before making any final decisions on your insurance company, it is important to learn as much as you can about your local insurance providers, and the coverages they offer. Call your local insurance agent to clear up any questions that you might have. Questions to consider asking include, “What is the best coverage plan for me/my family/my situation?” “What are the minimum coverage requirements in my state and what form of coverage do you recommend?” “Do you guys offer any bundle discounts if I take out both my auto insurance and home insurance with you?” and “What is the average rate of insurance quotes you guys offer?”
Crucial Insights on Washington, D.C. Auto Insurance Coverage
Ensuring the best car insurance in Washington, D.C., is crucial, as 15.6% of drivers are uninsured. Opting for higher coverage above state minimums helps protect against financial risks.
Comparing quotes from Allstate, Travelers, and Progressive, with rates as low as $20 per month, allows drivers to find affordable premiums. Knowing what car insurance covers and taking advantage of discounts while raising liability limits ensures better protection on the road.
Find your best auto insurance rate for Washington, D.C., by entering your ZIP code into our comparison tool.
Frequently Asked Questions
What are the D.C. car insurance requirements?
Washington, D.C. car insurance requirements mandate a minimum liability coverage of 25/50/10 for all drivers. It’s recommended that higher coverage limits be purchased to ensure better financial protection in case of accidents.
What is the average car insurance cost in Washington, D.C.?
The average cost of car insurance in Washington, D.C., varies based on coverage levels, with premiums ranging from $20 for minimum coverage to $114 for full coverage. Providers like USAA offer competitive pricing for minimum coverage options.
What are the teen driver laws related to auto insurance in Washington, DC?
In Washington, D.C., teen drivers must be covered under a parent’s or separate policy until they turn 18. Teen drivers may face higher premiums, which contribute to the average cost of car insurance in D.C., due to common risks faced by teen drivers, but discounts for good grades can help reduce the cost of auto insurance.
Does your car insurance have to match your driver’s license?
Yes, your car insurance must match the details on your driver’s license to be valid. This is crucial for ensuring that coverage aligns with Washington, D.C., car insurance laws.
What are the vehicle licensing laws for car insurance in Washington, DC?
Washington, D.C., car insurance laws require drivers to have valid insurance coverage to register and operate a vehicle. Proof of insurance must be shown when law enforcement requests to comply with D.C. regulations, including cheap car insurance in D.C. options.
How can people with accidents find car insurance?
Drivers with accidents on their records can find car insurance by comparing quotes from different providers. Companies offering the cheapest car insurance in Washington, D.C., often specialize in high-risk policies for drivers with accidents, including filing a car insurance claim after an accident.
How long do you need SR-22 insurance in Washington state?
SR-22 insurance in Washington, D.C., is required for drivers with serious violations like DUIs and must be maintained for three years. This certification confirms that you have minimum coverage per D.C. car insurance laws.
Where can you find low-cost car insurance in Washington, D.C.?
For low-cost car insurance in D.C., comparing quotes from multiple providers is essential. USAA, Allstate, and Progressive offer competitive pricing for minimum and whole coverage policies.
What is Washington, D.C. car insurance for DUI?
Washington, D.C., car insurance for DUI offenders typically includes higher premiums and may require filing an SR22 insurance form. Drivers convicted of DUI must maintain this insurance for several years to stay compliant and can also consider car insurance quotes in Washington, D.C., to find the best rates. Additionally, understanding the dangers of distracted driving can help prevent future violations.
Can you get auto insurance with a bad driving record?
You can still get auto insurance in Washington, D.C., with a bad driving record, but premiums will likely be higher. Companies like Farmers and Geico specialize in providing coverage for high-risk drivers, although rates may vary based on individual circumstances.
What are the car insurance options in Washington, D.C.?
D.C. car insurance options include various coverage levels, such as minimum liability, full coverage, and additional protection, like uninsured motorist coverage. Allstate, Travelers, and Progressive often offer the best car insurance in Washington, D.C.


 1,734 reviews