
Best Car Insurance in Texas for 2026 [Check Out the Top 10 Companies]
The best car insurance in Texas comes from Geico, State Farm, and Progressive, with monthly rates starting at $23. Geico offers affordable rideshare add-ons, and State Farm covers Texas drivers during app-on periods. Also, Progressive helps Texans save between trips with Smart Haul rewards.
Read more


Find the Lowest Car Insurance Rates Today
Quote’s drivers have found rates as low as $42/month in the last few days!


Table of Contents
Table of Contents

Content Team Lead
Tonya Sisler has been a technical insurance writer for over five years. She uses her extensive insurance and finance knowledge to write informative articles that answer readers' top questions. Her mission is to provide readers with timely, accurate information that allows them to determine their insurance needs and choose the best coverage. Tonya currently leads a team of 10 insurance copywri...
Tonya Sisler

Licensed Insurance Agent
Brandon Frady has been a licensed insurance agent and insurance office manager since 2018. He has experience in ventures from retail to finance, working positions from cashier to management, but it wasn’t until Brandon started working in the insurance industry that he truly felt at home in his career. In his day-to-day interactions, he aims to live out his business philosophy in how he treats hi...
Brandon Frady
Updated May 2025
 19,116 reviews
Company Facts
Full Coverage
A.M. Best Rating
Complaint Level
Pros & Cons
19,116 reviews18,157 reviewsCompany Facts
Full Coverage
A.M. Best Rating
Complaint Level
Pros & Cons
18,157 reviews13,285 reviewsCompany Facts
Full Coverage
A.M. Best Rating
Complaint Level
Pros & Cons
13,285 reviewsThe best car insurance in Texas comes from Geico, State Farm, and Progressive. Geico offers the lowest starting rates at $23 per month and makes policy management easy with 24/7 online account access and mobile app support.

State Farm stands out for its local agents, offering Texans personal service, in-person claims support, and rideshare coverage during app-on periods.
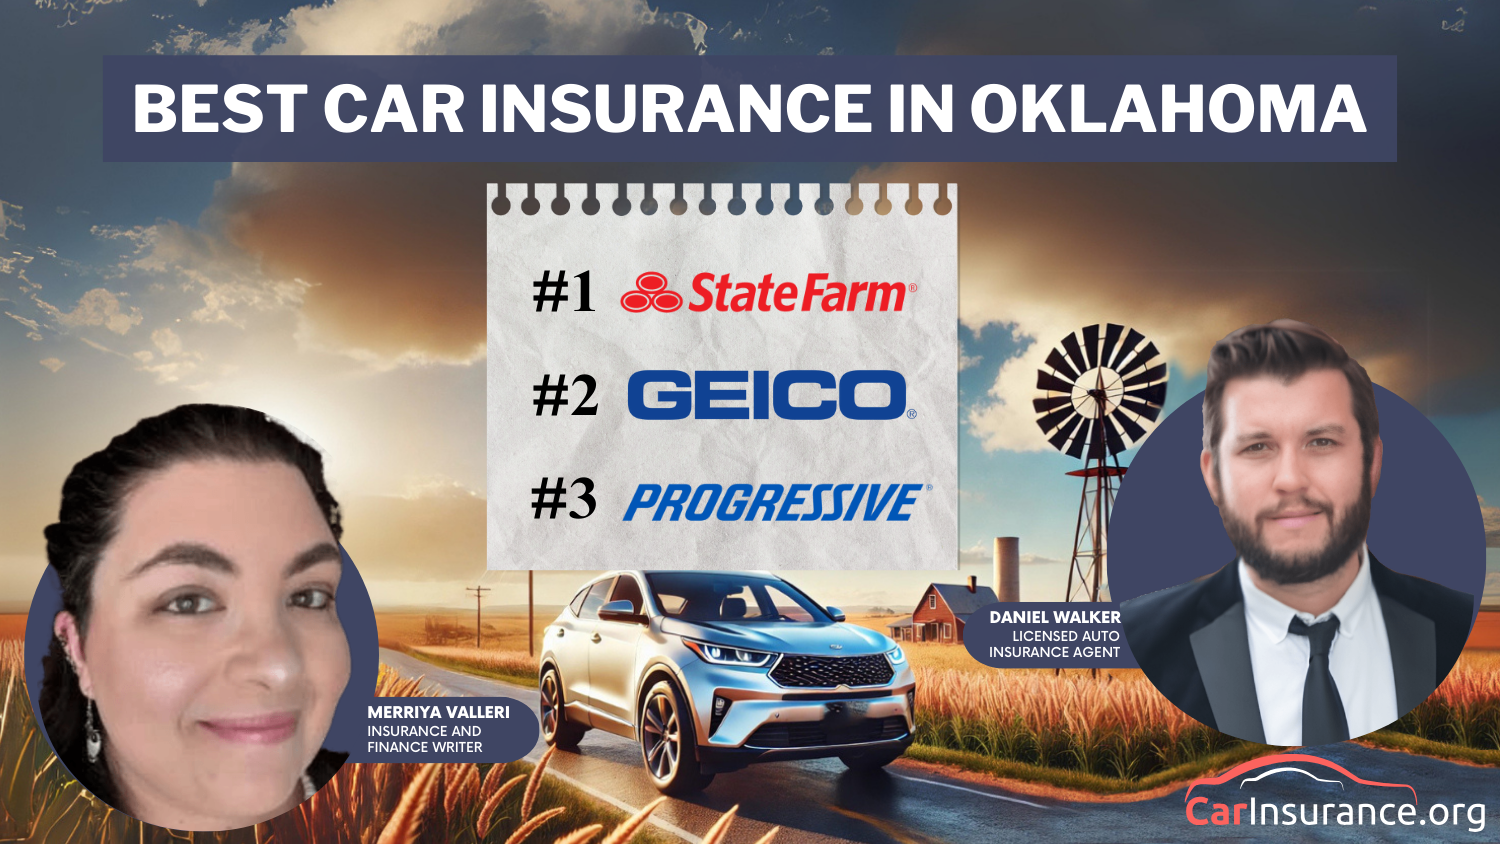
Our Top 10 Company Picks: Best Car Insurance in Texas
| Company | Rank | A.M. Best | Bundling Discount | Best For | Jump to Pros/Cons |
|---|---|---|---|---|---|
| #1 | A++ | 25% | Online Convenience | Geico | |
| #2 | A++ | 17% | Local Agents | State Farm | |
| #3 | A+ | 10% | Competitive Rates | Progressive | |

| #4 | A+ | 25% | Safe Driving | Allstate |
| #5 | A++ | 10% | Military Focus | USAA | |
| #6 | A | 25% | Customizable Coverage | Liberty Mutual | |
| #7 | A | 20% | Comprehensive Options | Farmers | |
| #8 | A+ | 20% | Simple Claims | Nationwide | |
| #9 | A | 25% | Discount Variety | American Family | |
| #10 | A++ | 13% | High-Risk Support | Travelers |
Progressive helps safe drivers save with Snapshot®, which tracks driving habits to offer personalized discounts. Let’s breakdown the car insurance guide from top companies, coverage options, and discounts to help you find the best car insurance in Texas.
- Geico offers the lowest premiums, starting at $23 per month
- State Farm provides personalized service to local agents
- Progressive rewards safe drivers with its Snapshot program
Find the best car insurance in Texas by entering your ZIP code into our comparison tool for instant quotes. Quickly compare rates from top providers and choose the perfect coverage for your needs.
#1 – Geico: Top Overall Pick
Pros
- Online Management: Texas drivers can handle policies, claims, and payments 100% online—no agent needed.
- Low Rates + Discounts: Starts at $23 monthly. Save 25% for bundling and 22% for five accident-free years.
- Fast Quotes: Get accurate Texas rates using your ZIP, vehicle, and driving history. Find out more by reading our “Geico Car Insurance Review.”
Cons
- No Local Agents: No in-person support in Texas; all service is online or by phone.
- Limited Add-Ons: This policy lacks accident forgiveness and custom equipment coverage, which sets it apart from Progressive and State Farm.
Free Insurance Comparison
Compare Quotes From Top Companies and Save
#2 – State Farm: Best for Local Agent Support

Pros
- Local Agent Support: Over 900 State Farm agents across Texas offer in-person help for claims and policy changes.
- Fast Claims Process: Local adjusters resolve most Texas auto claims in 3–5 business days. Explore further details in our “State Farm Car Insurance Review.”
- Multi-Policy Savings: Texas drivers can save up to 20% by bundling auto with homeowners, renters, or life insurance.
Cons
- Higher Premiums: Rates in Texas are typically 10–15% higher than Geico or Progressive for similar coverage.
- Strict Discount Rules: Drive Safe & Save requires telematics and consistent driving to qualify for the savings
#3 – Progressive: Best for Competitive Rates
Pros
- High-Risk Driver Discounts: Progressive offers lower Texas premiums for drivers with past violations, accident forgiveness, and savings of 20% or more.
- Snapshot Savings: Texas drivers using Snapshot can earn up to 30% off for safe habits like low mileage and gentle braking.
- Digital Policy Management: Claims, payments, and updates are handled entirely online or via app—no agent contact required.
Cons
- Significant Post-Claim Increases: Texas premiums can jump over 40% after an at-fault accident. Our article “Progressive Car Insurance Review” explores this further.
- No In-Person Support: Progressive has no local agents in Texas; all service is digital or phone-based.
#4 – Allstate: Best for Safe Drivers

Pros
- Up to 40% Safe Driving Discount: Texas drivers using Allstate’s Drivewise program can save up to 40% for maintaining safe driving habits.
- Fast Claims Turnaround: Most claims in Texas are processed and paid within 5–7 days via mobile tools and local adjusters.
- Valuable Add-Ons: Optional coverages include accident forgiveness and new car replacement for vehicles under two years old.
Cons
- Higher Rates After Violations: Drivers with tickets or at-fault accidents may pay up to 30% more than the Texas average. Find out more by reading our “Allstate Car Insurance Review.”
- Admin Fees for Changes: Policy updates, such as adding a driver, will incur administrative fees ranging from $50 to $75.
Free Insurance Comparison
Compare Quotes From Top Companies and Save
#5 – USAA: Best for Military Members

Pros
- Military Discounts: USAA offers military personnel parking their cars on base up to 15% of the total in Texas. Our article “USAA Car Insurance and Review” delves into the details.
- Highest-Rated Claims Service: USAA is one of the top-rated for Texas claims satisfaction, with quick processing and military-trained adjusters
- Lower Full Coverage Rates: USDA’s full coverage auto insurance in Texas averages 20-25% lower than the major competitors for eligible members.
Cons
- Limited Eligibility: USAA is only open to active military veterans and their families.
- Limited Physical Locations: USAA services in Texas are broadly online, with few local branches offering in-person assistance.
#6 – Liberty Mutual: Best for Customizable Coverage

Pros
- Flexible Policies: Customized coverage is provided by Liberty Mutual’s Texas insurance.
- A Few Insurance Discounts: Texas insurance from Liberty Mutual offers bundling and hybrid car discounts.
- Easy Insurance Online Claims: Texas insurance under Liberty Mutual is processed quickly online.
Cons
- Unpredictable Insurance Rates: Liberty Mutual’s insurance costs in Texas can unexpectedly change. Explore further details in our “Liberty Mutual Car Insurance Review.“
- Varied Insurance Service Reviews: Liberty Mutual’s insurance service in Texas is different for each region.
#7 – Farmers: Best for Comprehensive Coverage Options

Pros
- Variety of Insurance Coverage: Farmers’ insurance in Texas offers unique add-ons such as rideshare coverage.
- Loyalty-Based Discounts: Farmers’ insurance in Texas gives discounts to long-term clients. For additional insights, refer to our “Farmers Car Insurance and Review.”
- Financially Secure Insurance Company: Farmers’ insurance in Texas provides safe claim payments.
Cons
- Expensive Insurance for New Clients: Farmers’ insurance in Texas is more costly for new policyholders.
- Fewer Digital Insurance Features: Farmers’ insurance in Texas does not have sophisticated online management features.
Free Insurance Comparison
Compare Quotes From Top Companies and Save
#8 – Nationwide: Best for Simple Claims Process

Pros
- Fast Claims: Most Texas auto insurance claims Nationwide are approved within 48 hours and paid within five business days.
- Financial Strength: Nationwide, with an A+ rating from A.M. Best, has served Texas drivers reliably for over 60 years.
- Explore further details in our “Nationwide Car Insurance and Review.”
- Bundling Discount: Texas policyholders save up to 20% on auto insurance by bundling with homeowners coverage.
Cons
- Few Walk-In Locations: Texas customers must use phone or online channels, as Nationwide has fewer than 10 local agents statewide.
- High Initial Premiums: New drivers in Texas with Nationwide pay premiums 18–28% higher than the state average before applying any discounts.
#9 – American Family: Best for Discount Variety

Pros
- Targeted Discounts: Texas drivers can save up to 20% with teen driver, generational, and defensive driving discounts from American Family.
- Dedicated Local Agents: Over 150 licensed agents in Texas provide personalized insurance reviews and policy customization.
- Strong Financial Ratings: American Family holds an A rating from A.M. Best, with a consistent claims payout record for Texas auto claims.
Cons
- Uncompetitive Rates: Texas drivers who do not have home or renter insurance bundles pay a staggering 15–22% more than the average.
Coverage Gaps: American Family doesn’t offer auto insurance in parts of West Texas and the Panhandle. Explore further details in our “American Family Car Insurance Review.”
#10 – Travelers: Best for High-Risk Drivers

Pros
- Coverage of High-Risk Drivers: Travelers provides auto insurance in Texas to drivers with a driving history of traffic tickets or crashes.
- Financial Strength: Boasting an A++ rating by A.M. Best, Travelers has solid financial support for Texas clients, providing stable claims support.
- Specialized Add-Ons: Texas drivers can benefit from additional coverage options like accident forgiveness, which removes one at-fault accident from their record.
Cons
- Higher Rates for Low-Risk Drivers: Travelers charges 15–20% more for clean-record drivers in Texas than other insurers.
- Complex Policy Structure: Travelers’ extensive options can be complicated for new Texas customers to navigate. Read our “Travelers Car Insurance Review” to find out more.
Free Insurance Comparison
Compare Quotes From Top Companies and Save
Understanding Texas Car Insurance Costs
Texas law requires minimum liability coverage, but many drivers opt for full coverage due to risks like hail damage, highway collisions, and theft. Rates vary by driver type, location, and insurer.
Car Insurance Monthly Rates in Texas by Coverage Level
| Insurance Company | Minimum Coverage | Full Coverage |
|---|---|---|
|
| $75 | $201 |
| $65 | $176 | |
| $51 | $137 | |
| $39 | $105 | |
| $66 | $178 | |
| $57 | $154 | |
| $45 | $121 | |
| $33 | $90 | |
| $37 | $101 | |
| $23 | $62 |
The average monthly cost of car insurance in Texas is $92. Rates depend on driving history, vehicle type, and coverage level. Comparing quotes is the best way to find savings.
Car Insurance Rates in Texas by Age and Gender
Young drivers pay significantly more for coverage in Texas, especially teens. For instance, a 17-year-old male could pay $556/month with Geico, while a 35-year-old female might pay just $104. Here’s a sample breakdown across key age groups:
Full Coverage Car Insurance Monthly Rates in Texas by Age & Gender
| Insurance Company | Age: 17 Female | Age: 17 Male | Age: 25 Female | Age: 25 Male | Age: 35 Female | Age: 35 Male | Age: 60 Female | Age: 60 Male |
|---|---|---|---|---|---|---|---|---|
|
| $245 | $322 | $102 | $106 | $92 | $95 | $69 | $69 |
| $265 | $325 | $110 | $115 | $95 | $98 | $75 | $78 | |
| $295 | $345 | $120 | $125 | $105 | $108 | $79 | $82 | |
| $513 | $556 | $125 | $136 | $104 | $108 | $97 | $105 | |
| $285 | $335 | $115 | $120 | $98 | $100 | $82 | $85 | |
| $871 | $976 | $166 | $176 | $115 | $118 | $92 | $94 | |
| $235 | $294 | $94 | $109 | $92 | $95 | $77 | $77 | |
| $240 | $310 | $100 | $105 | $90 | $92 | $74 | $75 | |
| $270 | $330 | $112 | $118 | $96 | $99 | $79 | $81 | |
| $87 | $90 | $87 | $90 | $85 | $88 | $73 | $73 |
As you see from the table, in some cases, car insurance for teenagers in Texas costs thousands more than for older drivers. Unfortunately, for parents, those insurance rates are thousands of dollars higher than what they pay. However, in some instances, married folks pay less than their single counterparts.
Cheapest Car Insurance Rates by City in TX
We’ve also collected data on car insurance rates by city. Below is a list of the least expensive and most expensive cities for car insurance.
Texas Car Insurance Rates by City
| City | Least Expensive Rate | Most Expensive Rate |
|---|---|---|
| Abilene | $132 | $200 |
| Amarillo | $126 | $195 |
| Arlington | $173 | $305 |
| Austin | $190 | $290 |
| Beaumont | $160 | $224 |
| Brownsville | $120 | $180 |
| Corpus Christi | $157 | $220 |
| Dallas | $180 | $285 |
| Fort Worth | $177 | $255 |
| Frisco | $205 | $312 |
| Garland | $170 | $260 |
| Grand Prairie | $164 | $270 |
| Houston | $185 | $298 |
| Killeen | $149 | $239 |
| Longview | $140 | — |
| Lubbock | $116 | $175 |
| McAllen | $122 | $190 |
| Mesquite | $167 | $267 |
| Midland | $146 | $245 |
| Odessa | $129 | $205 |
| Plano | $200 | $321 |
| Round Rock | $198 | $250 |
| San Angelo | $152 | $215 |
| San Antonio | $193 | $279 |
| Tyler | $143 | $230 |
| Wichita Falls | $136 | $210 |
Besides USAA, which is only for military-affiliated families, State Farm is a great option, occupying 18 of the top 25 slots for the least expensive car insurance in Texas. The table below reflects the top 25 cities in Texas with the most expensive rates on car insurance.
Texas Report Card: Auto Insurance Premiums
| Category | Grade | Explanation |
|---|---|---|
| Weather-Related Risks | B- | Risk from hurricanes and hailstorms in some areas |
| Traffic Density | B | High traffic in metro areas, lighter in rural zones |
| Average Claim Size | B | Repair costs are moderate with some spikes |
| Vehicle Theft Rate | C | Urban centers see higher theft rates |
| Uninsured Drivers Rate | C- | A fair number of uninsured drivers across the state |
In addition to gender and age, where you live can affect your car insurance rates. We’ve collected data on the least and most expensive ZIP codes, so search to see where your ZIP code lands on the list. The table below reflects Texas’s top 25 ZIP codes with the lowest car insurance rates:
Full Coverage Car Insurance Monthly Rates in Texas by ZIP Code
| ZIP Code | City | Monthly Rate |
|---|---|---|
| 75205 | Dallas (Highland Park) | $633 |
| 77024 | Houston (River Oaks) | $610 |
| 78703 | Austin (Clarksville) | $595 |
| 77401 | Bellaire | $583 |
| 75225 | Dallas (University Park) | $577 |
| 76109 | Fort Worth (Tcu Area) | $561 |
| 77019 | Houston (Montrose) | $554 |
| 78209 | San Antonio (Alamo Heights) | $552 |
| 75093 | Plano (West Plano) | $543 |
| 78746 | Austin (Westlake Hills) | $538 |
| 75230 | Dallas (Preston Hollow) | $532 |
| 77056 | Houston (Galleria Area) | $523 |
| 75024 | Plano (East Plano) | $514 |
| 77450 | Katy (Cinco Ranch) | $510 |
| 75025 | Plano (West Plano) | $501 |
| 78704 | Austin (South Austin) | $498 |
| 75230 | Dallas (North Dallas) | $495 |
| 75093 | Plano (Willow Bend) | $487 |
| 77007 | Houston (Washington Corridor) | $482 |
| 78258 | San Antonio (Stone Oak) | $477 |
| 77381 | The Woodlands | $473 |
| 77079 | Houston (Energy Corridor) | $470 |
| 75056 | The Colony (Stonebridge Ranch) | $465 |
| 78731 | Austin (North Austin) | $461 |
State Farm customers in San Angelo pay the lowest rates in Texas, averaging $2,428 annually. USAA offers competitive rates, but only to military members and their families.
Texas drivers should compare at least three quotes to find the best rate, especially with premiums varying so much by city and ZIP code.Chris Abrams Licensed Insurance Agent
Here’s a list of the largest and best car insurance companies in Texas. Take a look at this list of auto insurance companies in Texas and their market shares.
Largest Insurance in Texas by Provider
| Insurance Company | Direct Written Premiums | Loss Ratio | Market Share |
|---|---|---|---|
| $3,563,120 | 78.29% | 16.83% | |
| $2,637,489 | 88.18% | 12.46% | |
|
| $2,362,584 | 66.19% | 11.16% |
| $2,041,345 | 68.91% | 9.64% | |
| $1,842,735 | 66.07% | 8.70% | |
| $1,712,949 | 88.30% | 8.09% | |
| $1,195,735 | 83.96% | 5.65% | |
| $693,004 | 77.31% | 3.27% | |
| $541,825 | 86.45% | 2.56% | |
| $473,342 | 65.53% | 2.24% |
State Farm is the largest provider in Texas, where 16.83% of Texans purchase their insurance. Gain more insights about the factors that affect the price of car insurance rates in Texas.
Commuter Car Insurance Rates by Company
Driving longer distances each day doesn’t always mean higher insurance costs—except in select cases. The tables below compare such factors based on each carrier.
Full Coverage Car Insurance Monthly Rates in Texas by Annual Mileage
| Insurance Company | 6,000 Miles | 12,000 Miles |
|---|---|---|
|
| $446 | $468 |
| $404 | $404 | |
| $267 | $267 | |
| $267 | $277 | |
| $380 | $400 | |
| $322 | $322 | |
| $310 | $325 | |
| $270 | $285 | |
| $350 | $370 | |
| $250 | $265 |
Most company rates don’t change when the drive shortens to a 10-mile commute, except for Allstate, which offers rate reductions of over $260.
Credit History Ratings by Auto Insurance Firms
Texas’s average credit score is 656, compared to the national average of 675. Drivers with poor credit typically pay higher car insurance rates.
Full Coverage Car Insurance Monthly Rates in Texas by Credit Score
| Insurance Company | Good Credit | Fair Credit | Poor Credit |
|---|---|---|---|
|
| $150 | $190 | $250 |
| $140 | $180 | $240 | |
| $180 | $220 | $280 | |
| $120 | $150 | $200 | |
| $190 | $230 | $300 | |
| $160 | $200 | $270 | |
| $150 | $190 | $260 | |
| $130 | $170 | $230 | |
| $180 | $220 | $290 | |
| $110 | $140 | $190 |
If you have coverage through Geico and have poor credit, you can expect to pay nearly $4,000 more for car insurance than someone with good credit.
How Your Driving Record Affects Rates by Car Insurance Companies
Clean driving records help you save the most. Just one speeding ticket or accident can significantly increase your premium. For example, at Nationwide, a single speeding violation may raise your rate by over $400.
Full Coverage Car Insurance Monthly Rates in Texas by Driving Record
| Insurance Company | Clean Record | One Ticket | One Accident | One DUI |
|---|---|---|---|---|
|
| $130 | $150 | $210 | $230 |
| $120 | $140 | $190 | $210 | |
| $160 | $180 | $240 | $260 | |
| $100 | $130 | $170 | $190 | |
| $170 | $200 | $270 | $290 | |
| $140 | $160 | $210 | $230 | |
| $130 | $160 | $220 | $240 | |
| $110 | $140 | $190 | $210 | |
| $150 | $180 | $240 | $260 | |
| $90 | $120 | $160 | $180 |
By understanding how factors like age, location, driving record, and coverage level affect your premium, you can make smarter decisions and potentially save hundreds of dollars per year. Always compare quotes from multiple providers and adjust your coverage to fit your needs and budget.
Car Insurance Discounts in Texas
Many top Texas car insurance companies offer generous discounts that can significantly reduce your rates. Here’s a breakdown of common discounts available:
Car Insurance Discounts in Texas
| Company | Anti-Theft | Bundling | Good Driver | Good Student | UBI |
|---|---|---|---|---|---|
|
| 10% | 25% | 25% | 20% | 30% |
| 25% | 25% | 25% | 20% | 30% | |
| 10% | 20% | 30% | 15% | 30% | |
| 25% | 25% | 26% | 15% | 25% | |
| 35% | 25% | 20% | 15% | 30% | |
| 5% | 20% | 40% | 15% | 40% | |
| 25% | 10% | 30% | 10% | $231/yr | |
| 15% | 17% | 25% | 25% | 30% | |
| 15% | 13% | 10% | 8% | 30% | |
| 15% | 10% | 30% | 10% | 30% |
Companies like Nationwide, Liberty Mutual, Geico, and American Family stand out for offering some of the most generous discount programs in the state. Nationwide provides up to 40% savings for good drivers and usage-based insurance, while Liberty Mutual offers up to 35% off for anti-theft features and 30% through telematics programs (Read more: Car Insurance with Telematics).
Geico also delivers strong savings, including up to 25% for bundling and anti-theft, and 26% for good driving habits. American Family matches those savings with up to 25% discounts across bundling, good driver, and anti-theft categories.
Take advantage of Texas car insurance discounts—safe driving, bundling, and low mileage can easily shave 20% or more off your premium.Tracey L. Wells Licensed Insurance Agent & Agency Owner
By stacking multiple discounts—such as for bundling policies, maintaining a clean driving record, using telematics, or being a good student—drivers can reduce their premiums while maintaining quality coverage.
Texas Minimum Car Insurance Coverage Requirements
If you own a vehicle and plan on driving it anywhere in the state of Texas, you are required by law to purchase insurance in case you are in an accident. Let’s take a look at Texas minimum liability insurance requirements:
- $30,000 for bodily injury liability per person injured in an accident you cause
- $60,000 for total bodily injury liability when two or more people are injured in an accident you cause
- $25,000 for property damage per accident you cause
While these limits satisfy state law, they may not be enough to cover all damages in a serious crash. Many drivers add collision, comprehensive, and personal injury protection (PIP) to ensure broader financial protection.
The importance of additional coverage becomes even clearer when you consider the frequency of accidents in major Texas cities. Below is a snapshot of how major cities in Texas compare in terms of annual auto accidents and insurance claims:
Accidents & Claims per Year in Texas by City
| City | Accidents per Year | Claims per Year |
|---|---|---|
| Austin | $25,000 | 20,000 |
| Dallas | $36,000 | 29,500 |
| Fort Worth | $21,000 | 16,800 |
| Houston | $40,000 | 32,000 |
| San Antonio | $28,000 | 22,500 |
Areas with higher accident volumes often lead to increased claims and repair costs, putting drivers at greater financial risk.
Penalties for Driving Without Insurance in Texas
Texas drivers are legally required to carry proof of insurance and must present it in several situations: when requested by a police officer, after being involved in an accident, when registering or renewing a vehicle, applying for or renewing a driver’s license, and during vehicle inspections.
Penalties for Driving Without Insurance in Texas
| Offense | Penalty |
|---|---|
| 1st Offense | $175–$350 fine, $250/year for 3 years, possible impound |
| 2nd Offense | $350–$1,000 fine, $250/year for 3 years, license risk |
| 3rd+ Offense | Higher fines, suspension, possible jail |
| With Accident | License suspension, impound, full liability |
Failing to maintain active insurance coverage can lead to serious financial and legal penalties.
Teen Driver Laws
Teen drivers in Texas must complete a state-approved driver education course to receive a learner’s permit, which is available starting at age 15. To qualify for a provisional license at age 16, teens must meet specific training and driving requirements. Those who haven’t completed driver education must wait until age 18 to obtain a license.
Requirements For Getting A License In Texas
| Requirements for Getting a License in Texas | Details |
|---|---|
| Mandatory Holding Period | 6 months |
| Minimum Supervised Driving Time | 30 hours, 10 of which must be at night |
| Minimum Age | 16 years old (the minimum license age is 18 for applicants who have not completed driver education) |
For drivers with certain offenses or qualifying hardships, Texas offers restricted licenses that allow limited driving privileges—usually for essential activities like work, school, or medical appointments.
Restricted License Laws In Texas
| Restriction Type | Description |
|---|---|
| Eligibility | Available for certain offenses like DWI, DUI, or non-payment of fines. |
| Offenses | Includes DWI, DUI, and other suspensions. |
| License Availability | Granted if criteria are met through Texas DPS. |
| Restricted Use | Limited to activities like work, school, or medical visits. |
| Required Documents | Proof of insurance, SR-22 form, hardship proof. |
| Hardship License | For essential driving during suspension. |
| Application Process | Apply through DPS with possible hearing. |
| Duration | Restrictions last from a few months to a year. |
| Cost | Fees for application and related services. |
| Offense Eligibility | Varies by offense and repeat offenses. |
These licenses are granted by the Department of Public Safety and come with specific eligibility and documentation requirements.
DUI Laws
Driving under the influence is a serious offense in Texas. In 2017 alone, 1,468 deaths were attributed to drunk driving. Penalties increase with each offense and can lead to criminal charges, license suspension, and mandatory interlock devices.
DUI Laws in Texas
| DUI Laws in Texas | Details |
|---|---|
| Name for Offense | Driving under the influence (DUI) |
| BAC Limit | 0.08 |
| High BAC Limit | 0.15 |
| Criminal Status | 1st class B misdemeanor, 2nd in 5 years class A misdemeanor, 3rd+ third degree feonies |
| Look Back Period | unlimited/lifetime for sentencing; 5 years for 2nd+ when determining need for IID |
Distracted driving is just as dangerous as impaired driving, and Texas has implemented strict cell phone laws to minimize distractions behind the wheel. Texting while driving is banned for all drivers, and additional restrictions apply to young and school zone drivers.
Cell Phone Laws in Texas
| Law Description | Details |
|---|---|
| Handheld Cell Phone Use | Illegal to use a handheld cell phone while driving in school zones. |
| Texting While Driving | Texting while driving is illegal for all drivers, regardless of age. |
| Under 18 Restrictions | Drivers under 18 cannot use a cell phone (handheld or hands-free) while driving. |
| School Zone Law | No cell phone use (handheld) while driving through active school zones. |
| Hands-Free Use | Allowed if using a hands-free device (e.g., Bluetooth, voice command). |
| Exceptions to Texting Law | Emergency situations (e.g., reporting accidents) are exempt. |
| Penalties for Violations | Fines for texting while driving range from $25 to $99 for a first offense, and up to $200 for subsequent offenses. |
| DUI / Cell Phone | Using a phone while intoxicated or under the influence may lead to DUI charges. |
By understanding and following Texas insurance and driving laws, you’ll stay compliant, avoid steep penalties, and position yourself for the best possible car insurance rates. Being informed not only protects your wallet—it protects everyone on the road.
Free Insurance Comparison
Compare Quotes From Top Companies and Save
Texas Car Insurance Coverage Options Beyond the Minimum
Given Texas’s high accident rates, frequent severe weather (like hailstorms), and rising repair costs, many drivers choose to expand beyond the minimum. These additional coverages offer stronger protection:
- Collision Coverage: Pays for damage to your car after a crash, regardless of fault.
- Comprehensive Coverage: Covers non-collision damage like theft, vandalism, hail, or flood.
- Uninsured/Underinsured Motorist Coverage: Covers injuries and property damage caused by uninsured drivers—important since 14.1% of Texas drivers are uninsured.
- Personal Injury Protection (PIP): Pays for your medical bills and lost wages, regardless of fault.
To tailor your coverage to specific needs, Texas insurers offer a range of optional add-ons that provide valuable protection in unexpected situations.
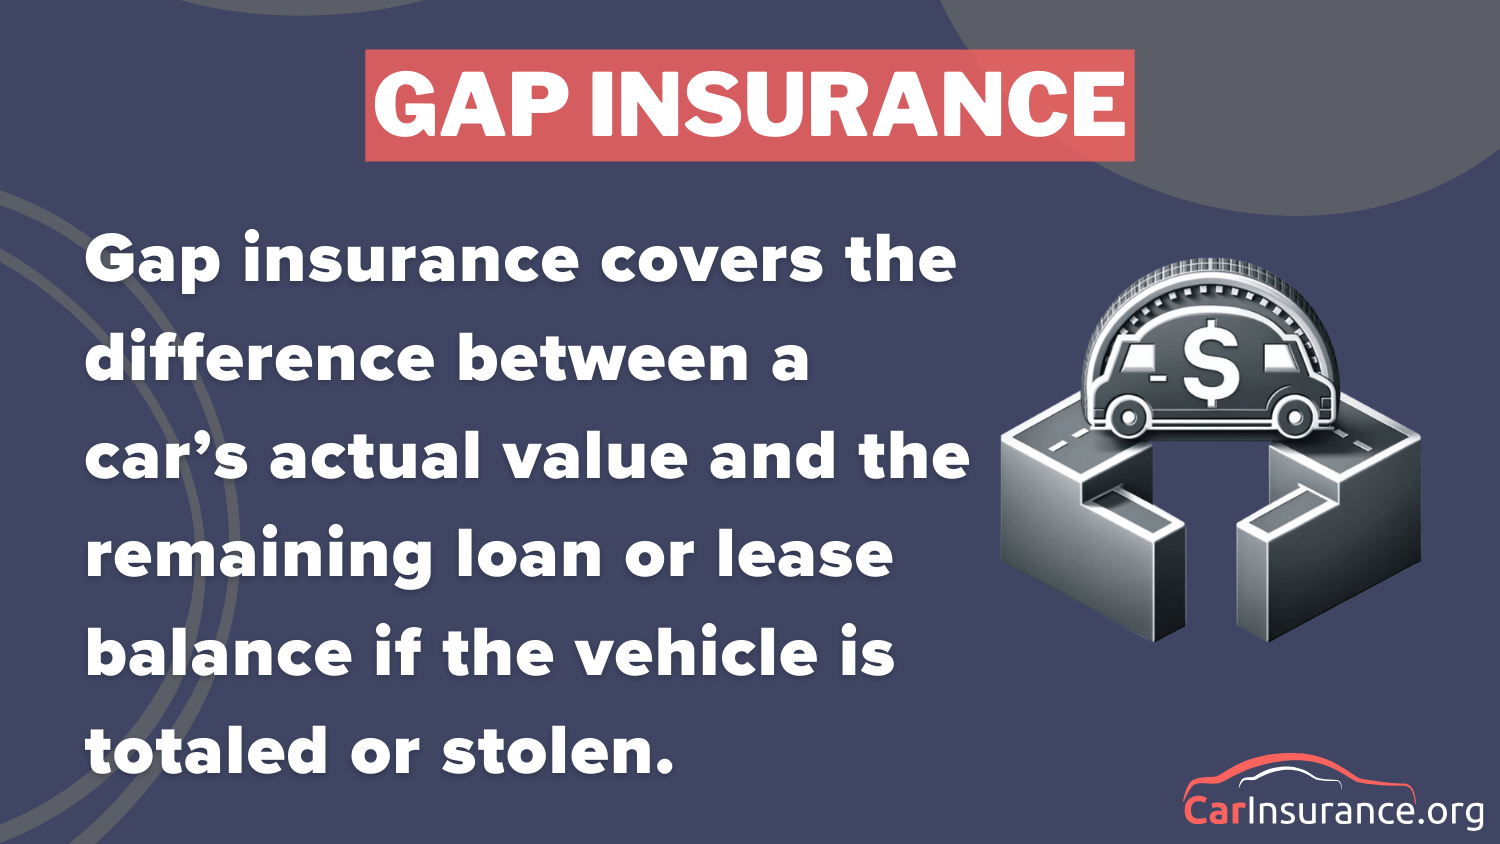
These include Guaranteed Auto Protection (GAP) to cover your remaining loan balance if your vehicle is totaled, a Personal Umbrella Policy (PUP) for extended liability coverage, and Rental Reimbursement to pay for a rental car while yours is being repaired.
Emergency Roadside Assistance covers services like towing and flat tire changes, while Mechanical Breakdown Insurance helps pay for major system failures not related to accidents.
Drivers with modified or classic cars can opt for specialized coverage, and those with safe or low-mileage driving habits can benefit from Usage-Based or Pay-As-You-Go Insurance programs that offer potential discounts.
Read more: Collision vs. Comprehensive Car Insurance
Car Insurance Companies With Best Ratings in TX
Texas drivers looking for reliable service and strong customer satisfaction can turn to J.D. Power’s annual U.S. Auto Insurance Study, which evaluates insurers based on real consumer feedback.
The study scores companies across five key areas: interaction, policy offerings, price, billing process and policy information, and claims handling. Each insurer is also assigned a Power Circle Rating to help simplify comparisons.
In the Mid-Atlantic region, which includes Texas, Allstate received the highest customer satisfaction score of 857 out of 1,000 and earned a perfect 5/5 rating. Other strong performers include Farm Bureau, Farmers, Liberty Mutual, and Nationwide, all scoring in the mid-830s with average customer satisfaction ratings.

State Farm and Geico follow closely, while Progressive and USAA scored lower, with USAA not officially ranked due to its military-only eligibility.
J.D. Power Ratings in Texas
| Insurance Company | Customer Satisfaction Rating (Out of 1,000) | JDPower.com Power Circle Ratings |
|---|---|---|
|
| 857 | 5/5 |
| 836 | 3/5 | |
| 836 | 3/5 | |
| 835 | 3/5 | |
| 835 | 3/5 | |
| 834 | 3/5 | |
| 831 | 3/5 | |
| 829 | 3/5 | |
| 816 | 2/5 | |
| 802 | 2/5 | |
| Texas Average | 894 | 5/5 |
Beyond satisfaction scores, it’s important to consider complaint ratios. The National Association of Insurance Commissioners (NAIC) tracks consumer complaints to evaluate how well insurers serve their policyholders. A complaint index of 1.00 represents the national average, with lower scores indicating fewer complaints relative to company size (Read more: Filing a Car Insurance Claim After an Accident).
5 Most Common Auto Insurance Claims in Texas
| Claim Type | Portion of Claims | Cost per Claim |
|---|---|---|
| Rear-End Collision | 32% | $3,600 |
| Fender Bender | 18% | $2,000 |
| Single Vehicle Accident | 14% | $4,800 |
| Side-Impact Collision | 11% | $5,900 |
| Theft Claim | 6% | $8,700 |
According to the latest data, Travelers, Farm Bureau, Geico, and Progressive had the fewest complaints, with indexes well below the national average. USAA and Farmers also performed reasonably well.
However, State Farm’s complaint index was significantly higher at 5.95, indicating a higher-than-average volume of customer grievances. Allstate had the most total complaints, though its index remained relatively low due to its large market share.
Texas Car Insurance Companies With the Highest Complaint Rates
Customer complaints are another important metric, but they should be interpreted with context. Below is the NAIC complaint index, where 1.00 represents the national average. Lower scores indicate fewer complaints relative to company size.
Car Insurance Complaint Ratio in Texas
| Company | Score | Total Complaints |
|---|---|---|
|
| 1.10 | 1,000 |
| 1.05 | 950 | |
| 1.00 | 1,100 | |
| 0.95 | 1,300 | |
| 1.15 | 1,250 | |
| 1.05 | 1,050 | |
| 1.00 | 1,200 | |
| 0.95 | 900 | |
| 1.10 | 1,100 | |
| 0.85 | 500 |
A high complaint index may not automatically mean poor service—it’s essential to balance this with satisfaction scores and the company’s market size.
How to Choose the Best Car Insurance Policy in Texas
Choosing the right car insurance policy in Texas means balancing price, protection, and provider reliability. Here are five key steps to help you make the best choice:
- Know Texas Minimum Requirements: Texas requires 30/60/25 liability coverage, but adding comprehensive, collision, PIP, and uninsured motorist coverage can offer much better protection, especially in high-risk areas.
- Compare Multiple Quotes: Rates in Texas vary by ZIP code, age, vehicle, and driving record, so compare at least three quotes from top providers like Geico, State Farm, and Progressive to find the best price for your situation.
- Evaluate Coverage Levels: Consider how much you can afford to pay out-of-pocket if you have an accident. Higher deductibles can lower monthly premiums, but make sure your coverage limits are high enough to protect your finances.
- Look for Discounts: Take advantage of Texas-specific discounts for safe driving, bundling, low mileage, anti-theft features, and good student performance. Some companies offer up to 40% in savings.
- Check Customer Reviews and Ratings: Review J.D. Power scores, complaint ratios, and customer feedback to choose a provider known for fair pricing, fast claims handling, and strong customer service.
By following these steps, you can confidently select a policy that fits both your budget and protection needs, giving you peace of mind every time you hit the road in Texas. Read our guide on the different types of car insurance coverage to help you choose the right policy.
Free Insurance Comparison
Compare Quotes From Top Companies and Save
Finding the Best Car Insurance in Texas
Finding the right car insurance in Texas doesn’t have to be complicated. While rates vary widely by driver profile, some of the most trusted providers—like USAA, State Farm, and Geico—offer monthly premiums starting as low as $23 to $39 for minimum coverage.
If you need to file a claim in Texas, contact your insurer immediately, document all damages with photos, and keep records of every conversation.Jeffrey Manola Licensed Insurance Agent
However, factors like your age, location, driving history, credit score, and vehicle type can all impact your final rate. That’s why it’s essential to compare policies not only by price, but also by coverage features, discounts, and customer satisfaction.
This comprehensive guide was created to help you navigate everything from Texas’ insurance requirements to provider rankings and city-by-city rate trends. Whether you’re a new driver, a parent insuring a teen, or just shopping for a better deal, you now have the insights needed about buying car insurance in Texas.
Stop overpaying for car insurance. Our free quote comparison tool allows you to shop for quotes from the top providers near you by entering your ZIP code.
Frequently Asked Questions
What is the best auto insurance in Texas?
Based on rates, coverage, and customer service, Geico, State Farm, and Progressive rank among the best car insurance companies in Texas. Geico offers the lowest starting rates at $23 per month, State Farm is highly rated for local agent support across 18 of Texas’s most affordable cities, and Progressive rewarding safe drivers with up to 30% off through its Snapshot® program.
Read more: Safe Driving Tips: How to Keep Your Insurance and Car Safe
What is the average monthly cost of car insurance in Texas?
The average monthly premium in Texas is $92, based on an annual rate of approximately $1,109, making it higher than the national average of $84 per month. Rates vary based on your city, driving record, and coverage level. For example, full coverage with State Farm starts at $90 per month, while Geico starts as low as $105 per month for broader protection.
Which car insurance providers offer the most affordable rates in Texas?
USAA offers the lowest rates starting at $23 per month, but eligibility is limited to military families. Among the general market, State Farm and Geico provide highly competitive rates, with State Farm averaging $2,428 annually in San Angelo, one of Texas’s cheapest regions for coverage.
Comparing car insurance rates by state can help determine how Texas rates compare to other regions.
What are the top car insurance companies in Texas for customer service?
According to J.D. Power’s U.S. Auto Insurance Study, Allstate holds the highest customer satisfaction score in Texas at 857/1000, while State Farm is widely recognized for its strong local agent network and personalized claims support. Farmers and Nationwide also perform well in service ratings, making them solid choices for Texans who value responsive customer care.
How can I find the best car insurance quotes in Texas?
You can find the best car insurance quotes by using online comparison tools. Simply enter your ZIP code to get instant quotes from top providers and identify the best Texas insurance company based on rates and coverage options.
Which companies offer the best full coverage car insurance in Texas?
Progressive, Geico, and State Farm offer strong full coverage options, protecting against theft, vandalism, hail, and collisions. Monthly full coverage rates start at $62 with USAA, $90 with State Farm, and $105 with Geico. .
Understanding how car insurance works can help you evaluate these options, and considering the average cost of full coverage car insurance in Texas ensures you find the best balance between price and protection.
Is full coverage car insurance required in Texas?
No, full coverage is not required by law in Texas—only liability insurance meeting the state’s 30/60/25 minimum is mandatory. However, full coverage, which includes comprehensive and collision, is often required by lenders if you finance or lease your vehicle. Even if it’s not required, full coverage is recommended for better protection against theft, weather, and accidents.
What factors influence the average cost of car insurance in Texas?
Your location, age, driving history, credit score, vehicle type, and coverage level all impact your premium. For example, 17-year-old drivers in Texas may pay over $500 per month, while safe, experienced drivers in their 30s may pay under $100. Urban areas like Houston and Dallas tend to have higher premiums due to traffic density and claim rates.
How do insurance ratings differ among Texas’s top providers?
Texas’s top insurers each excel in different areas. Geico is known for affordable pricing, State Farm for local agent support, Progressive for usage-based discounts, and Allstate for top-tier customer satisfaction. Checking J.D. Power ratings and NAIC complaint indexes can help you weigh customer satisfaction against service reliability.
For a comprehensive view, check out a nationwide car insurance review and consider Texas’s best-rated insurance companies for reliable coverage and service.
How can I compare auto insurance quotes in Texas to get the best deal?
Use free online comparison tools to view multiple quotes side by side. Enter your Texas ZIP code to compare real-time pricing from providers like Geico, State Farm, Progressive, and USAA. This is the fastest way to find the right balance between cost, coverage, and customer service based on your personal driving profile.


Get a FREE Quote in Minutes
Insurance rates change constantly — we help you stay ahead by making it easy to compare top options and save.

